Vertex confinement
This section of the validation suite describes the generation of primary event vertices and their confinement within a particular geometrical or physical volume.
These tests consist both of Geant4 visualisation plots showing the location of generated primaries as well as some statistical tests.
Natively sampleable solids
The first set of tests are related to sampling on the bulk or the surface of simple solids, these can be sampled natively (i.e. without rejection sampling).
Vertices sampled in simple solids.
You should see that the primaries are generated in the cylinder (far left), box (front center), orb (back and center) and also for the bulk simulation in the sphere section (front). It should also be possible to appreciate an apparent higher density of points for the surface simulation.
Complex solids
The next tests relate to generation of points on complex solids, generated from intersections and unions. Similar to the previous test simulations are performed both for the surface and the bulk.
Vertices sample in complex solids.
You should see points generated on the polycone (back left), in a box with a center cut out (directly in front of the polycone), in a solid formed of the intersection of a box and sphere (back right). You should also see points generated in the sphere with a box inside (front right). Again you should be able to appreciate a higher density of points on the surface in the surface simulation.
Unions and intersections
remage also has the possibility to generate primaries in a geometrical volume, i.e. a user defined shape not necessarily corresponding to any physical volume in the detector. In addition, there is the possibility to select vertices just in the intersection of a physical and geometrical volume or in the union of some physical and geometrical volumes. This subsection validates these features.
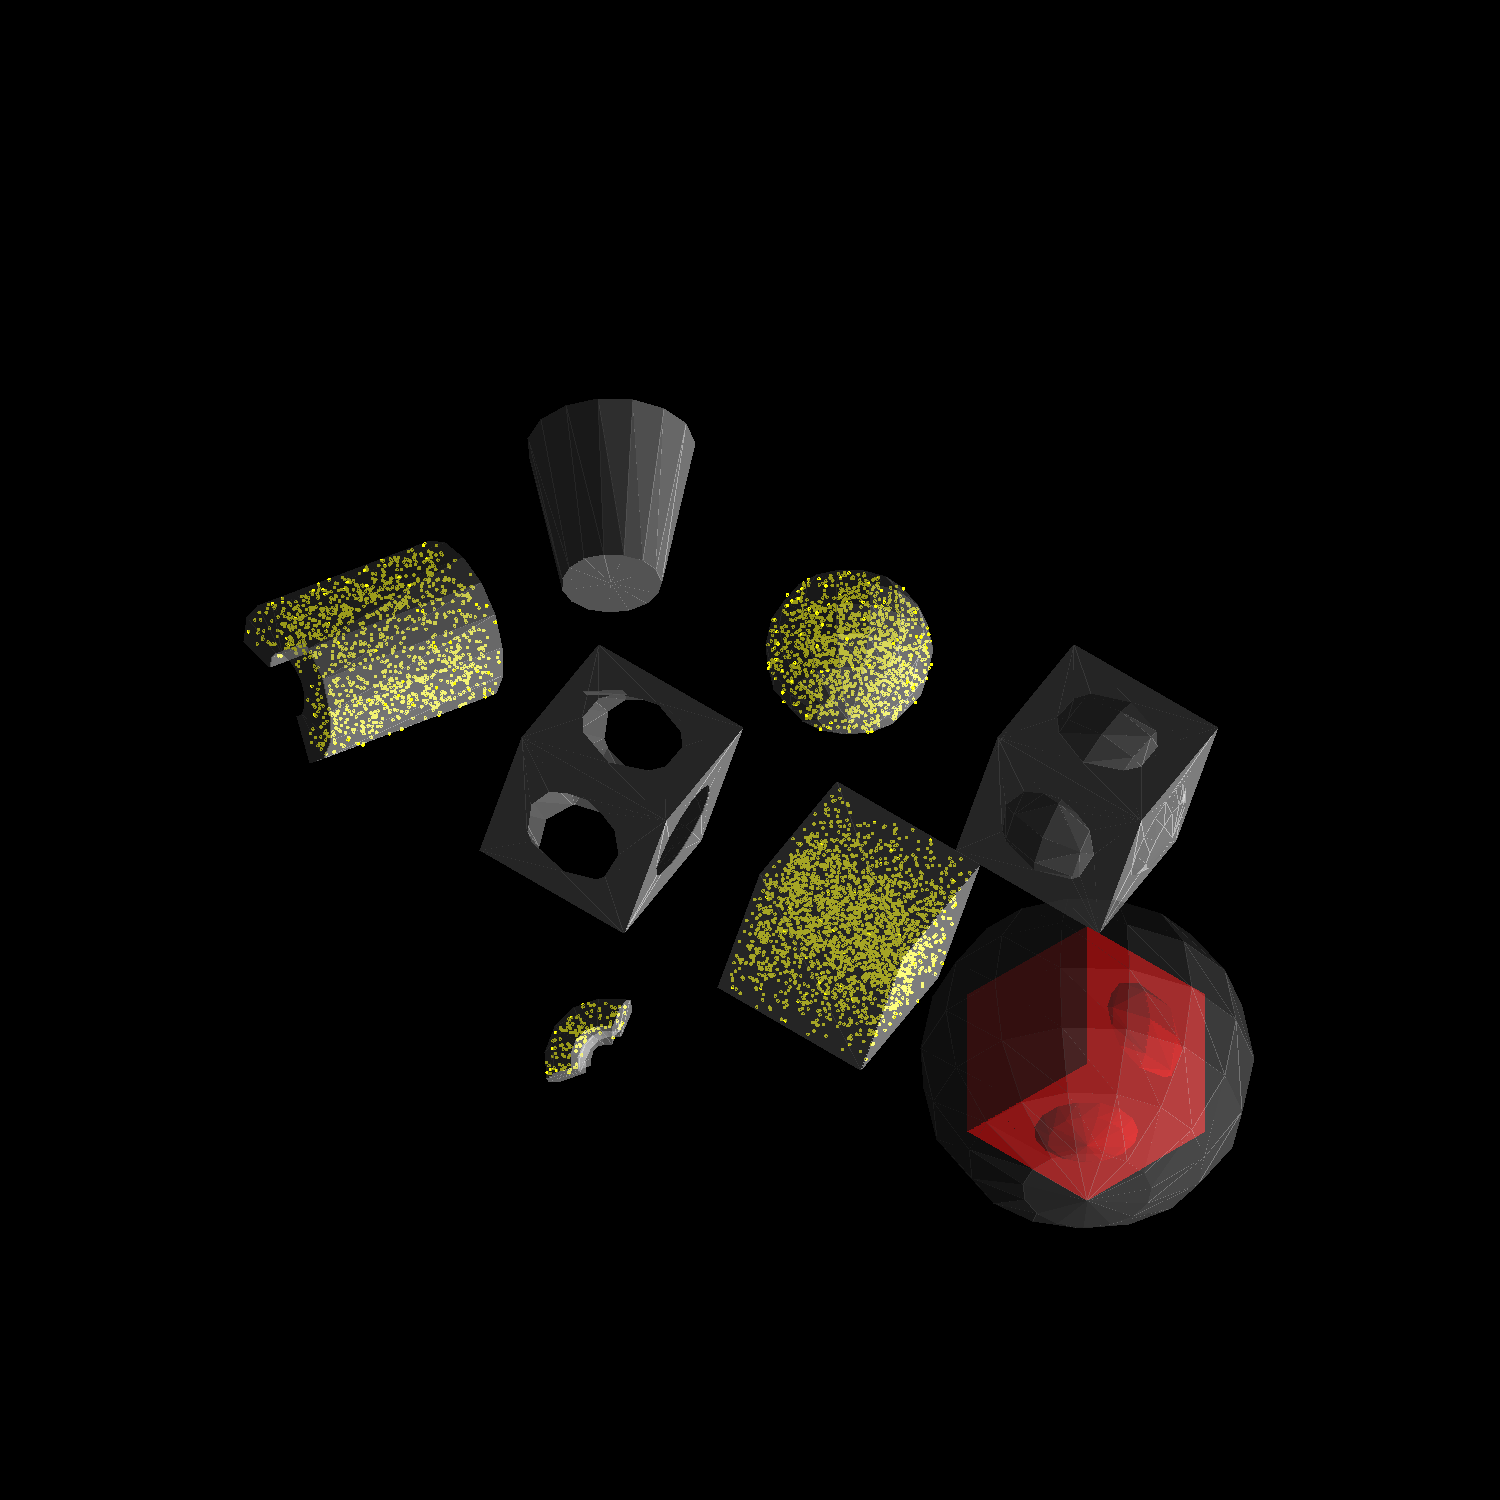
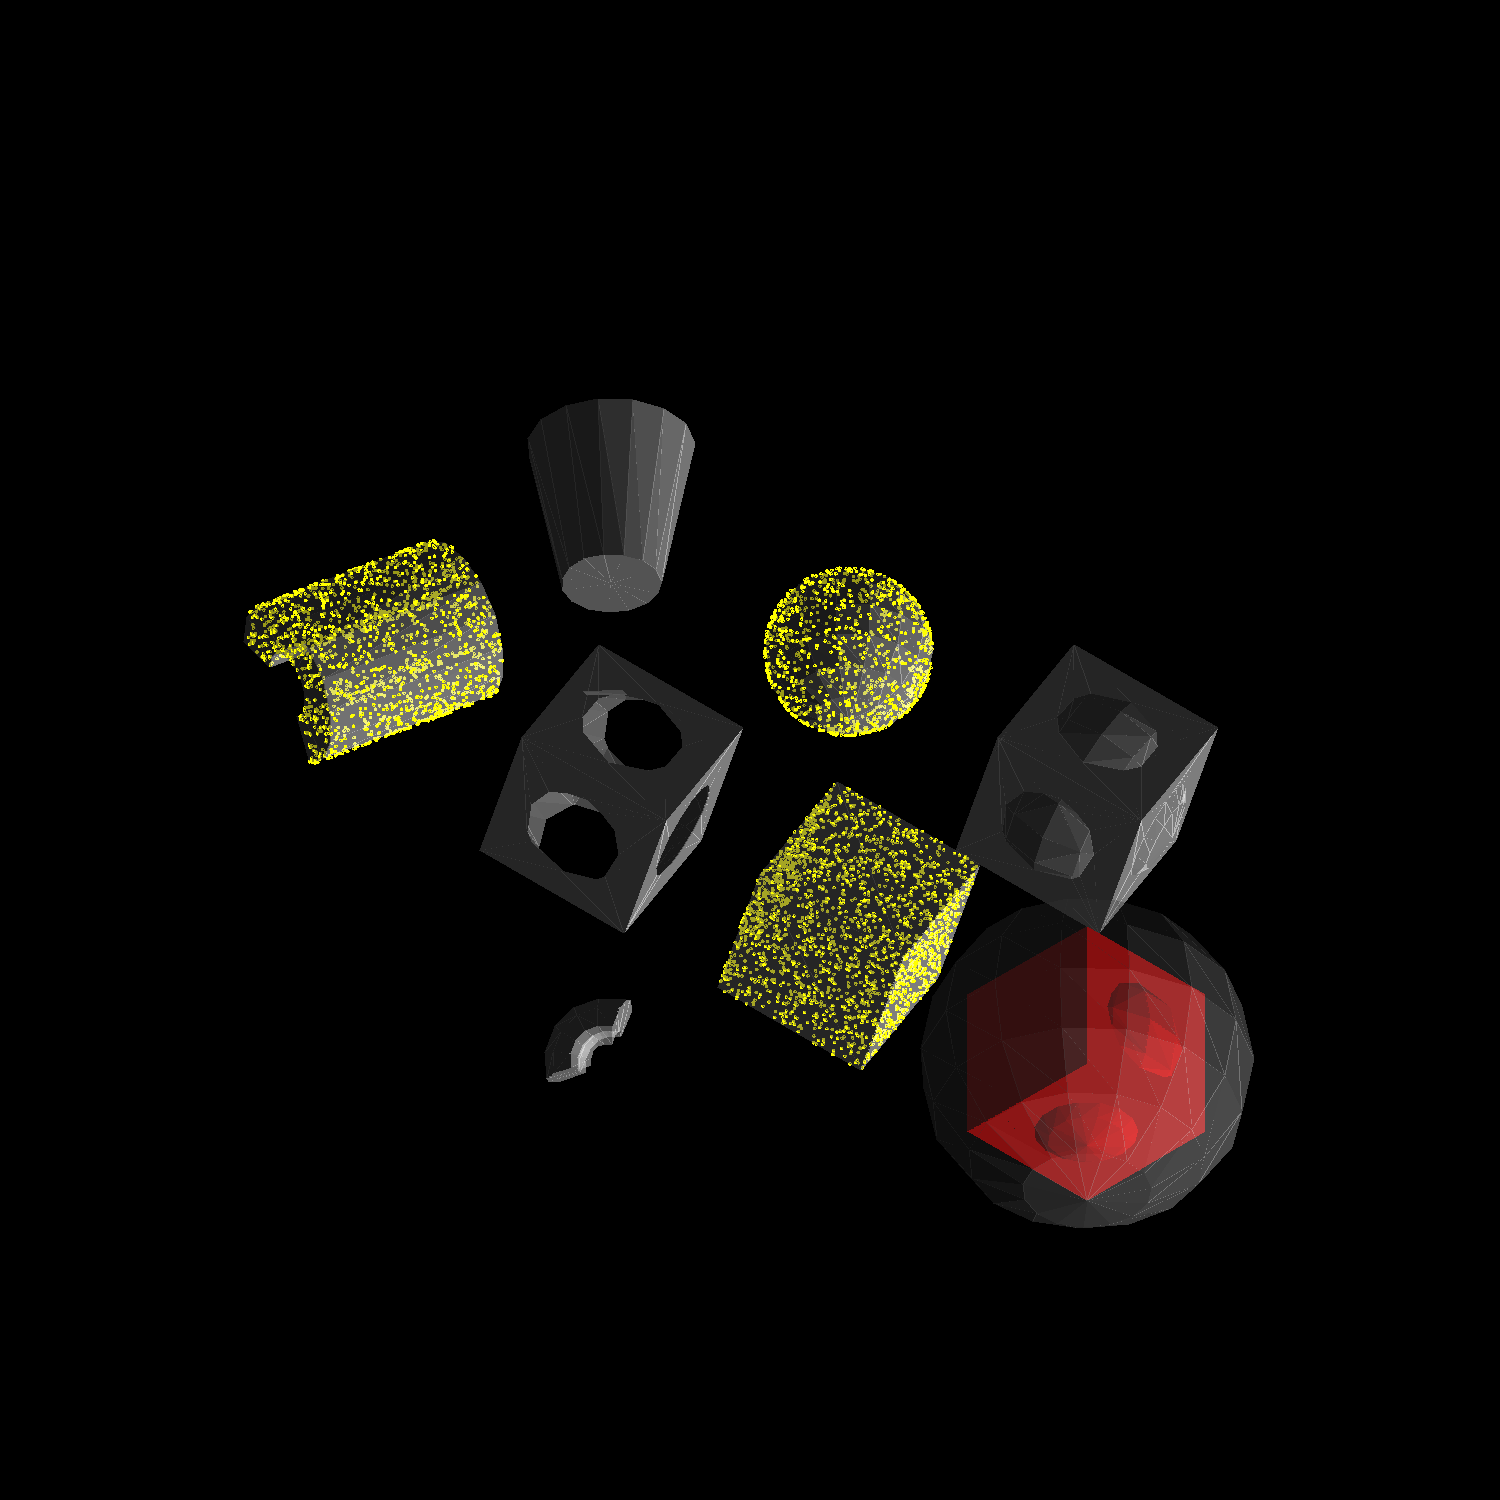
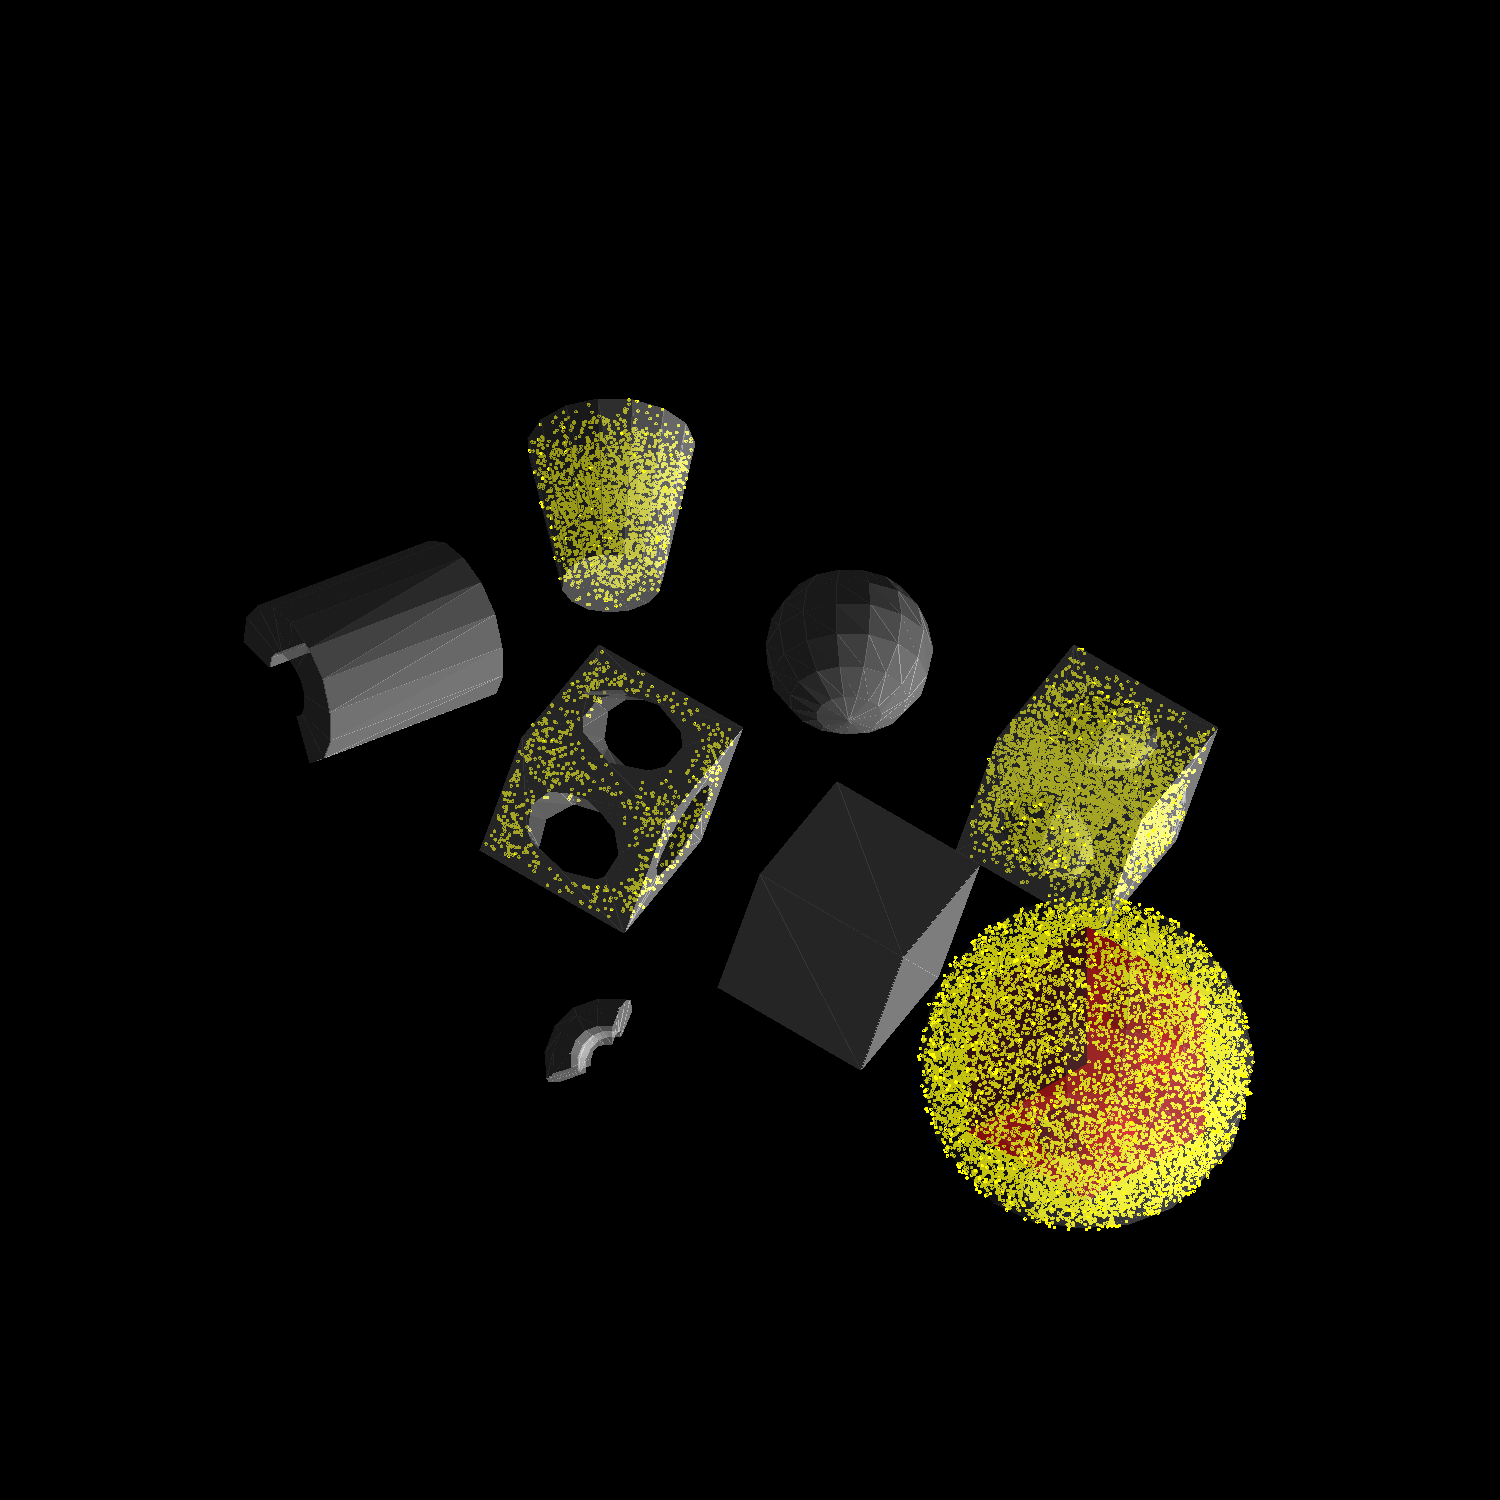
Checks on sampling for intersections and unions.
In the first case, you should see points sampled in three user defined volumes, a section of a cylinder (far left), a box (center back) and a sphere (center front - overlapping with a box).
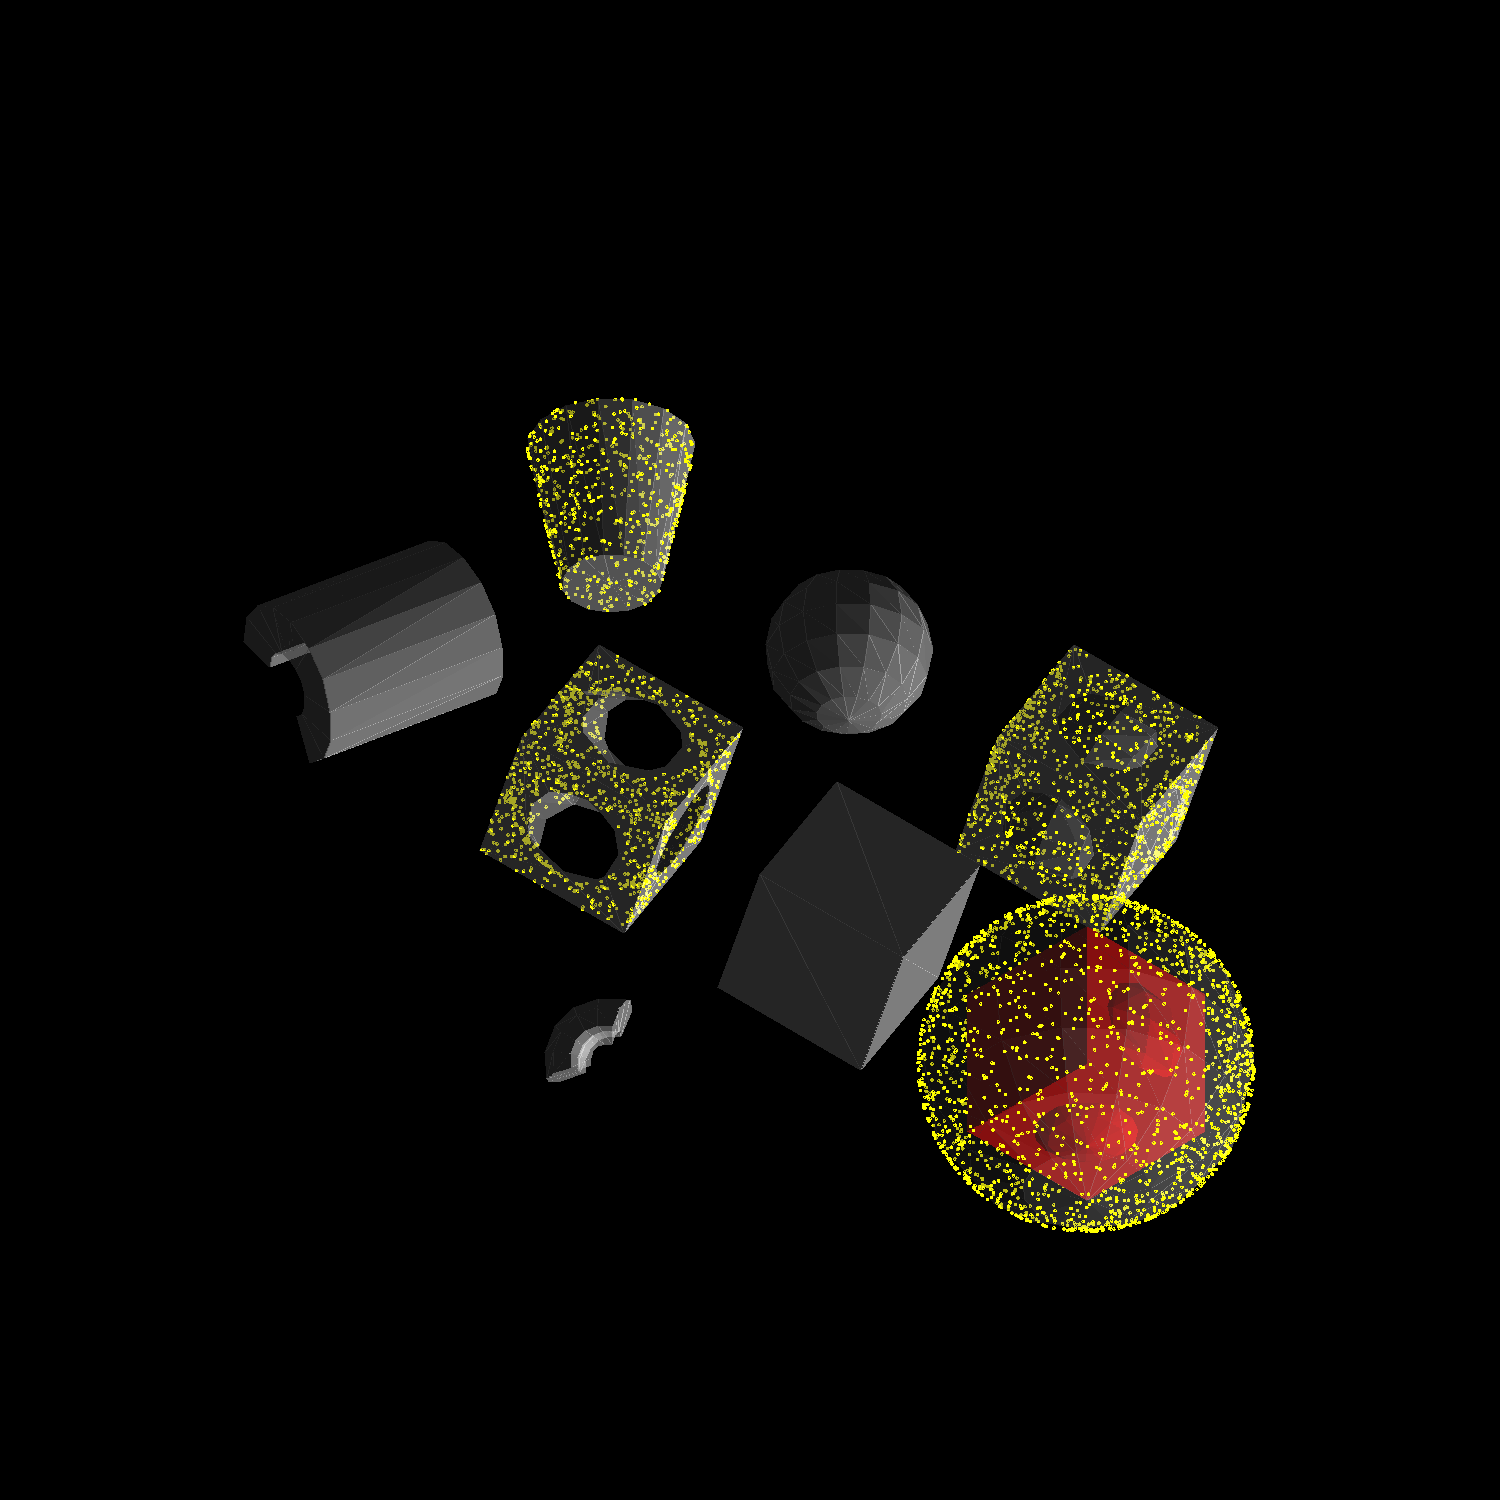
In the second plot, the primaries are generated either in the sphere (from the previous section), or a box (back right), or the small section of a cylinder (front center).
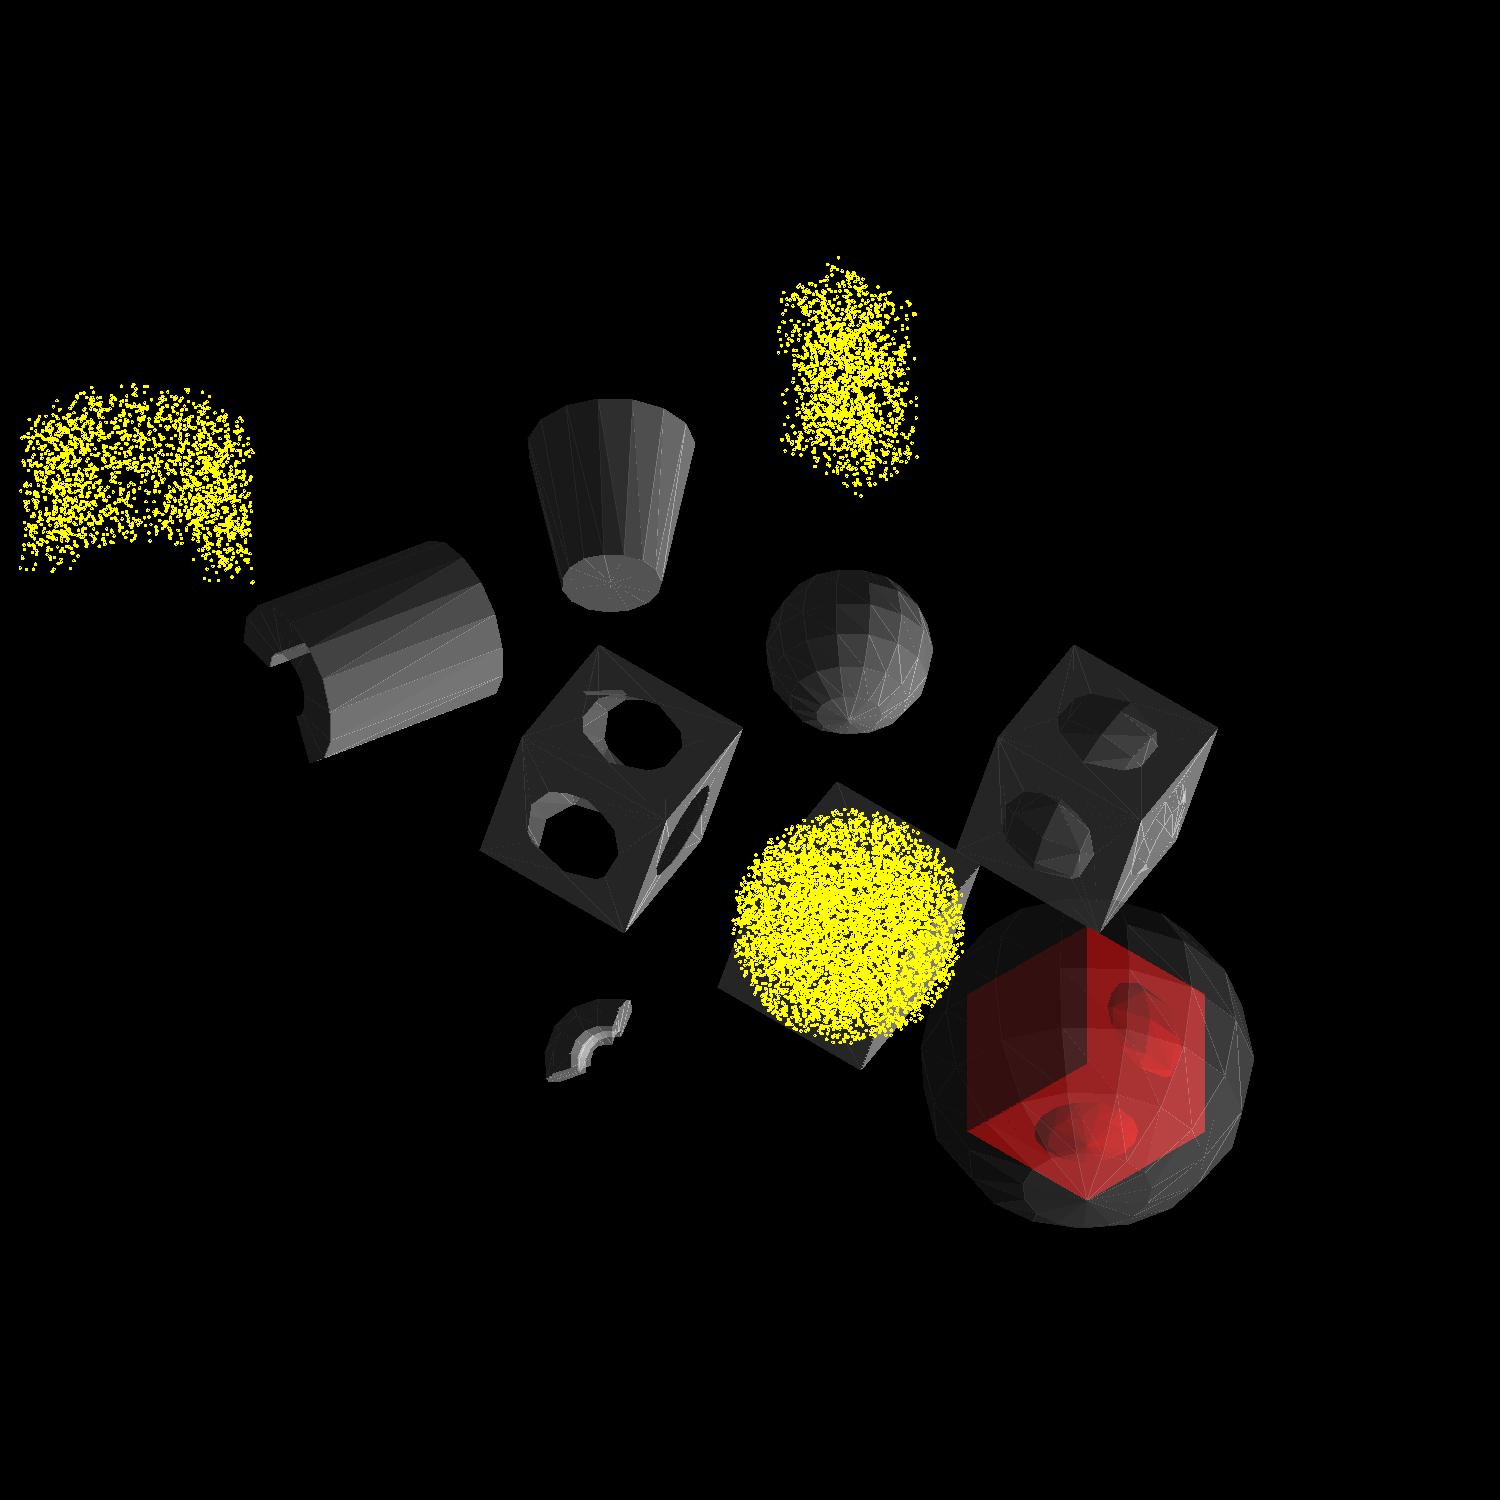
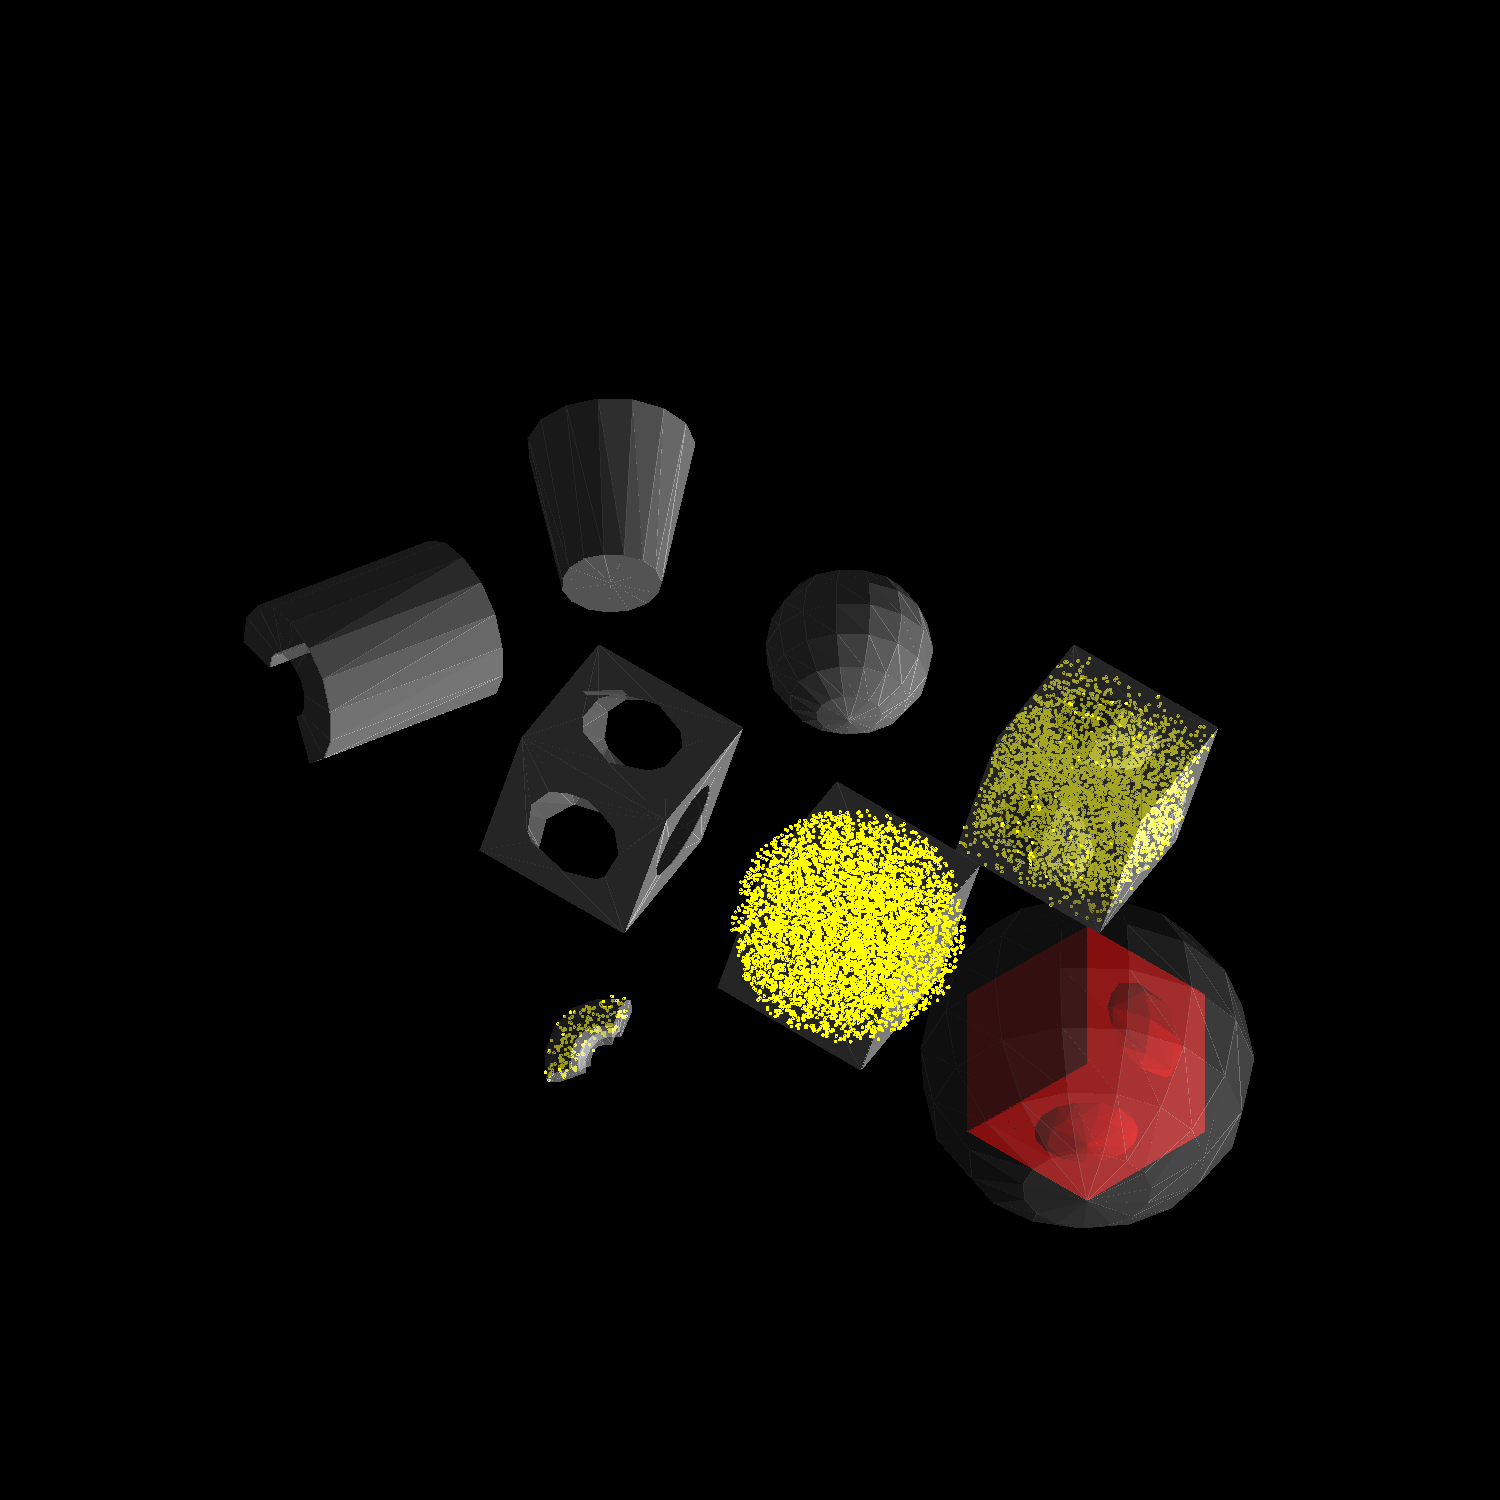
Finally in the last case primaries should be generated in the intersection of the sphere (front right) with a user defined smaller sphere.
Volumes with daughters
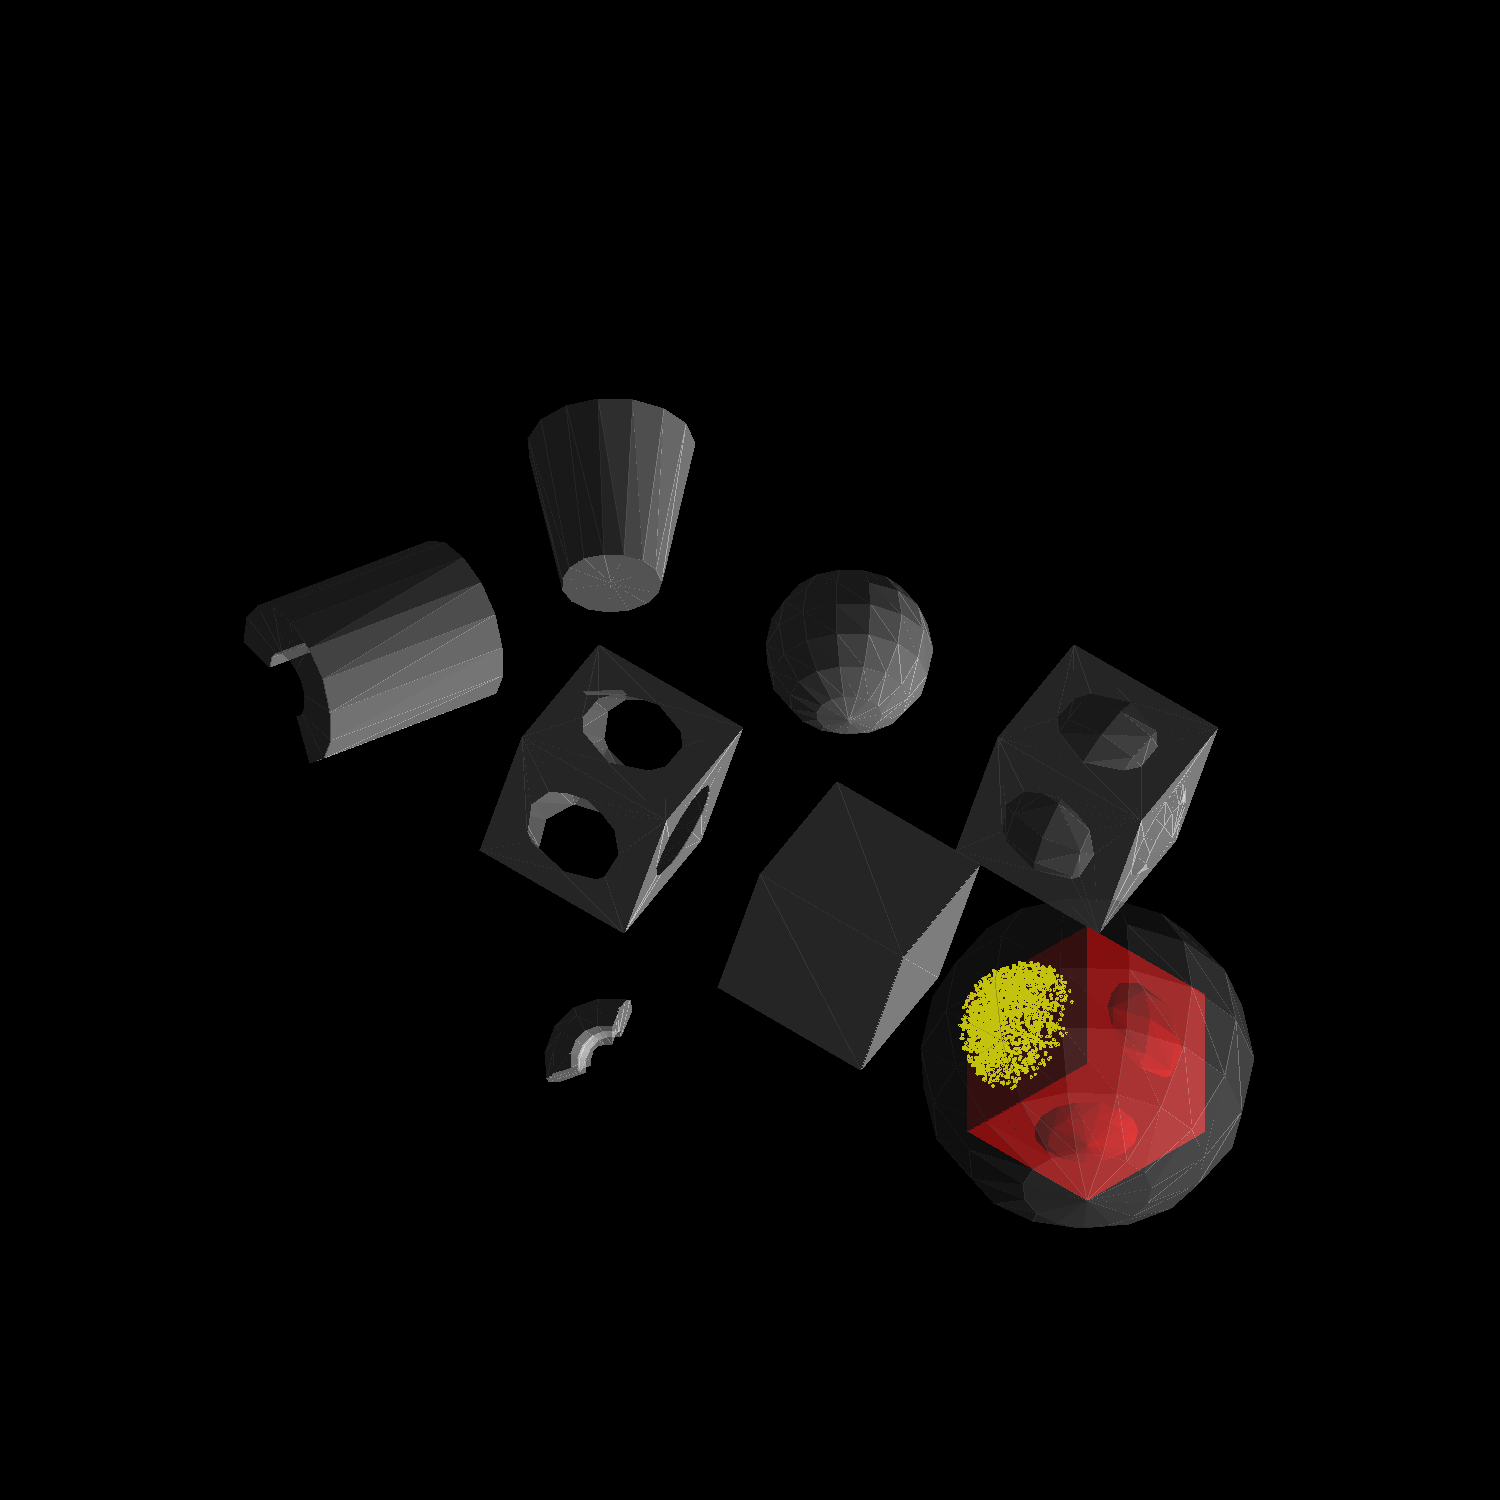
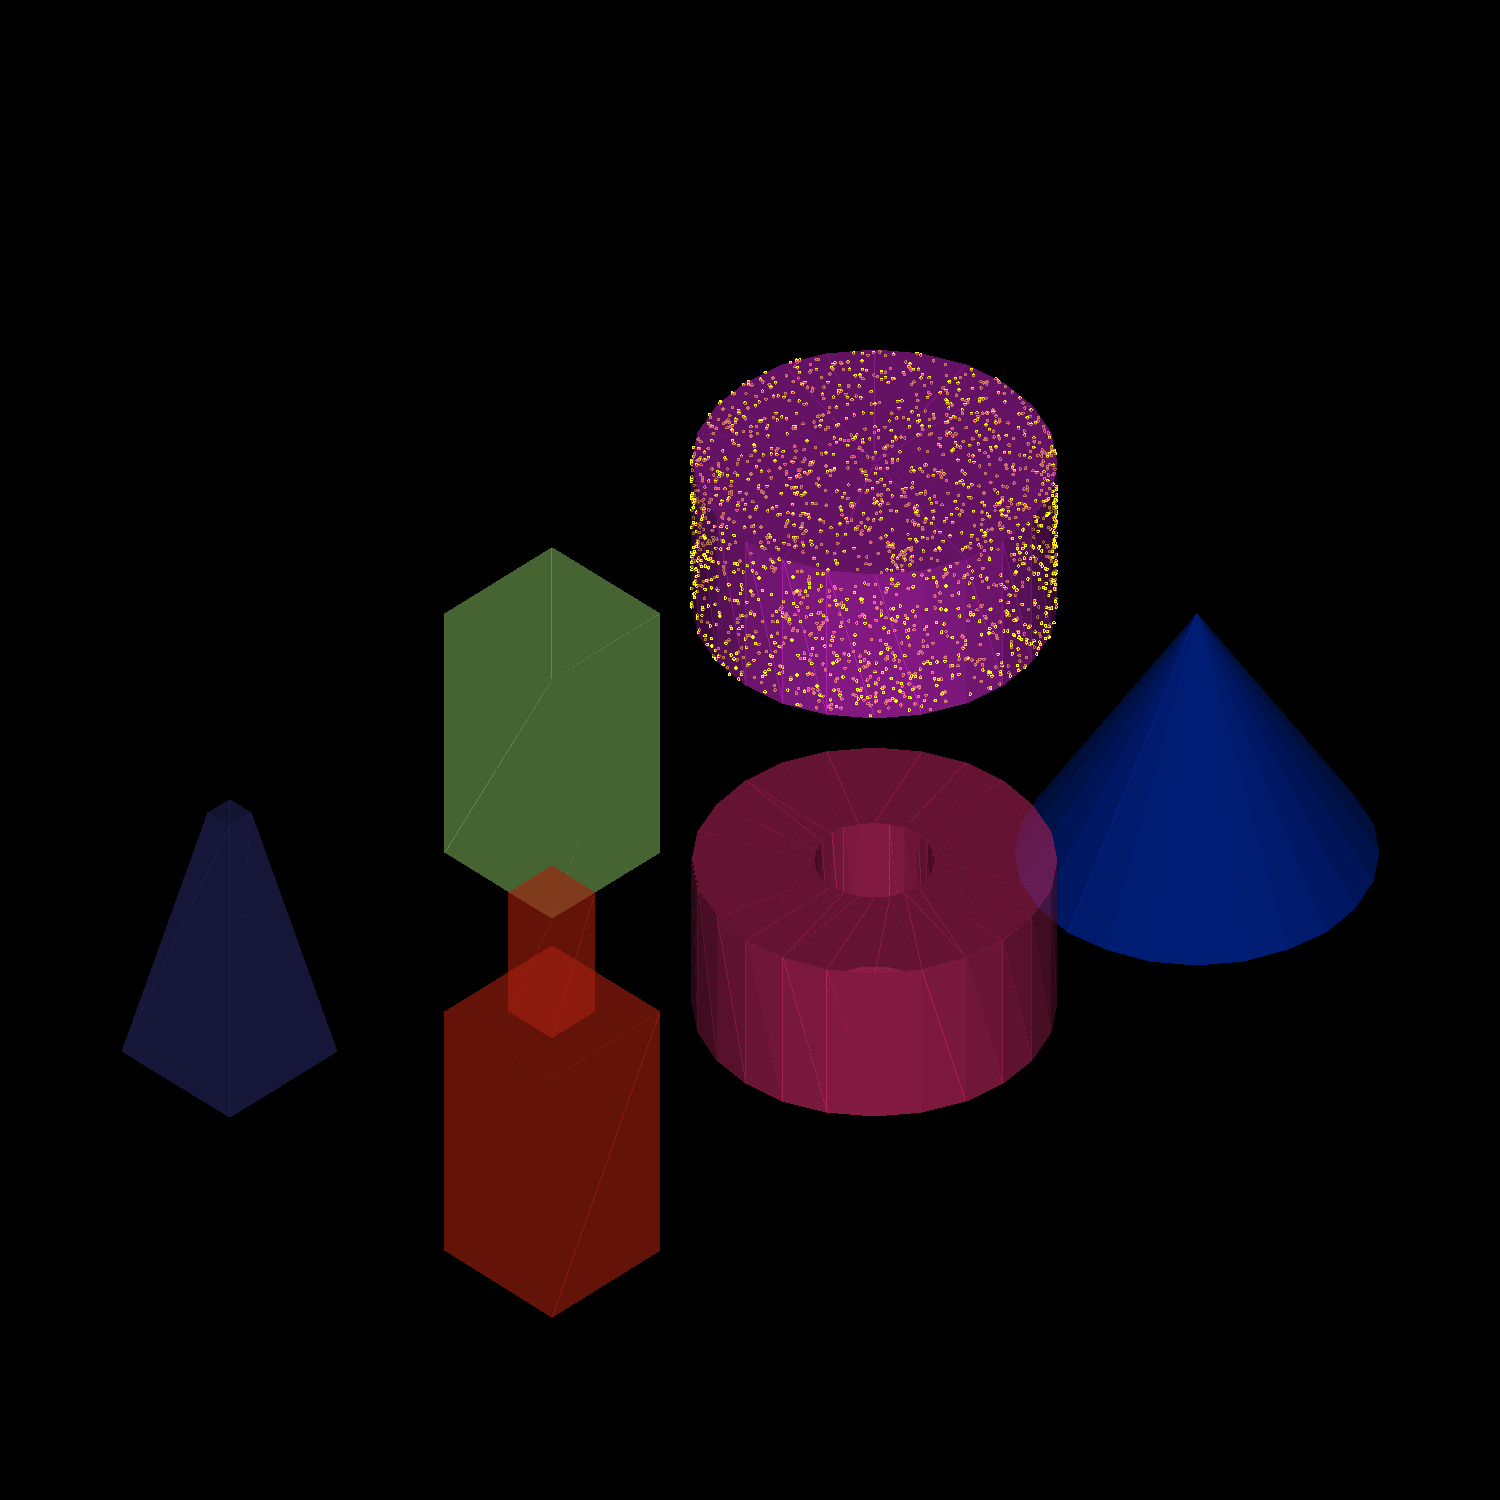
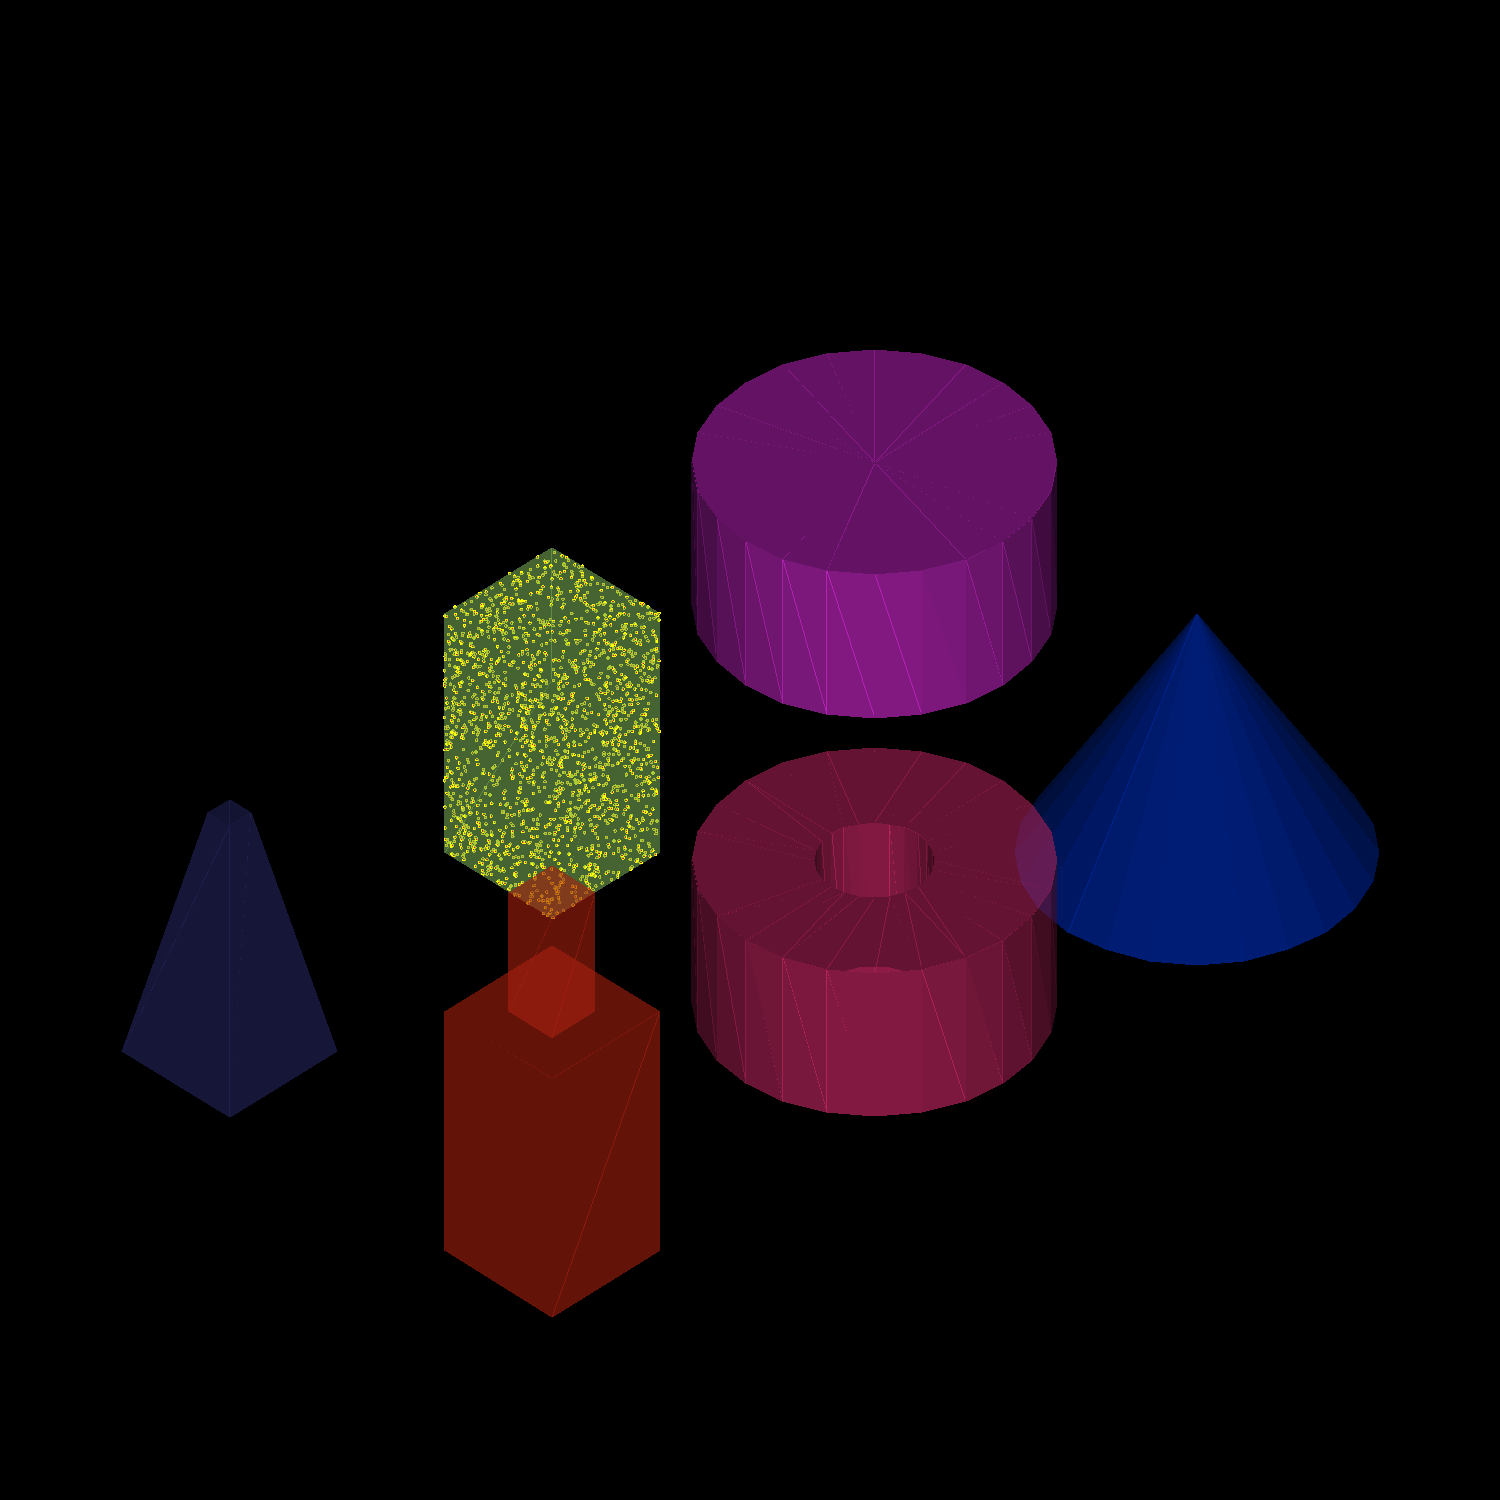
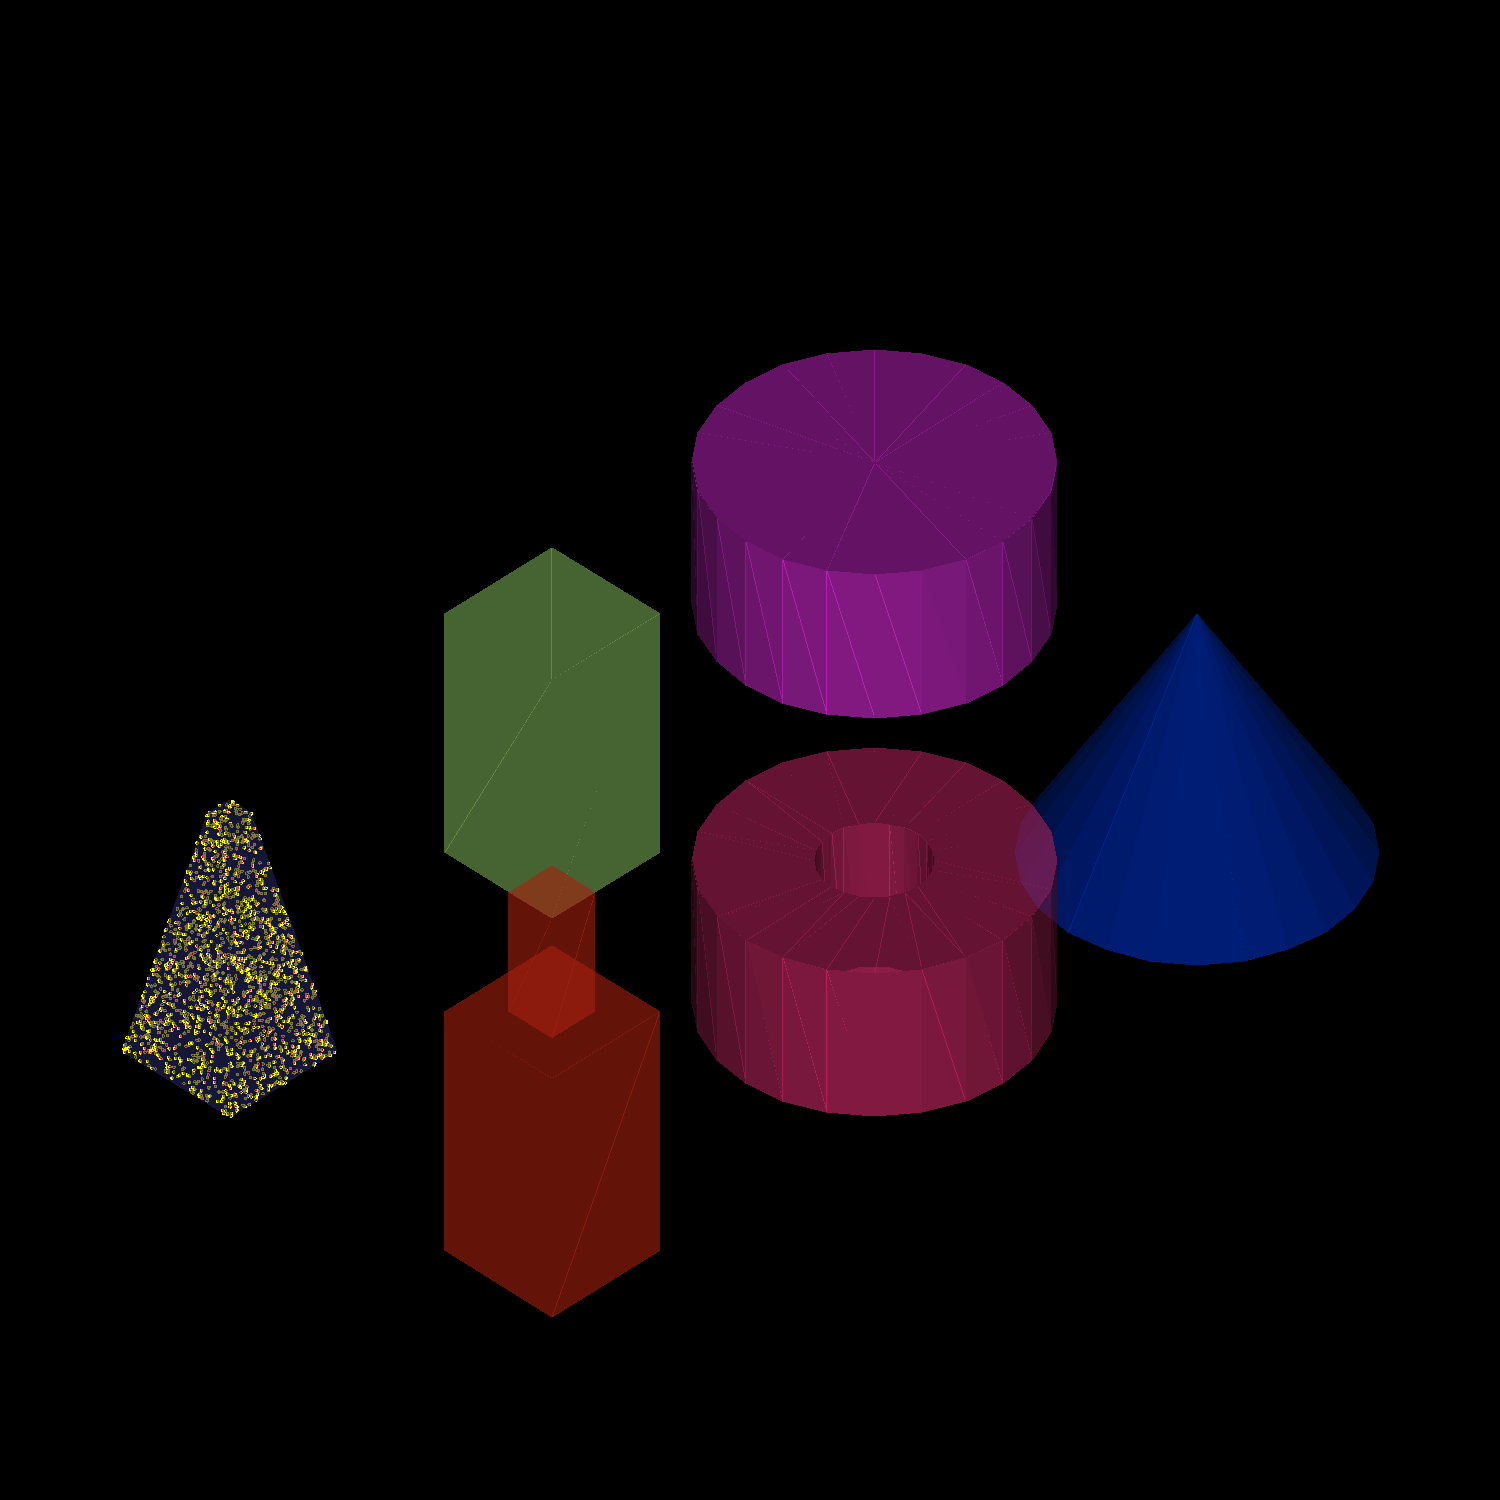
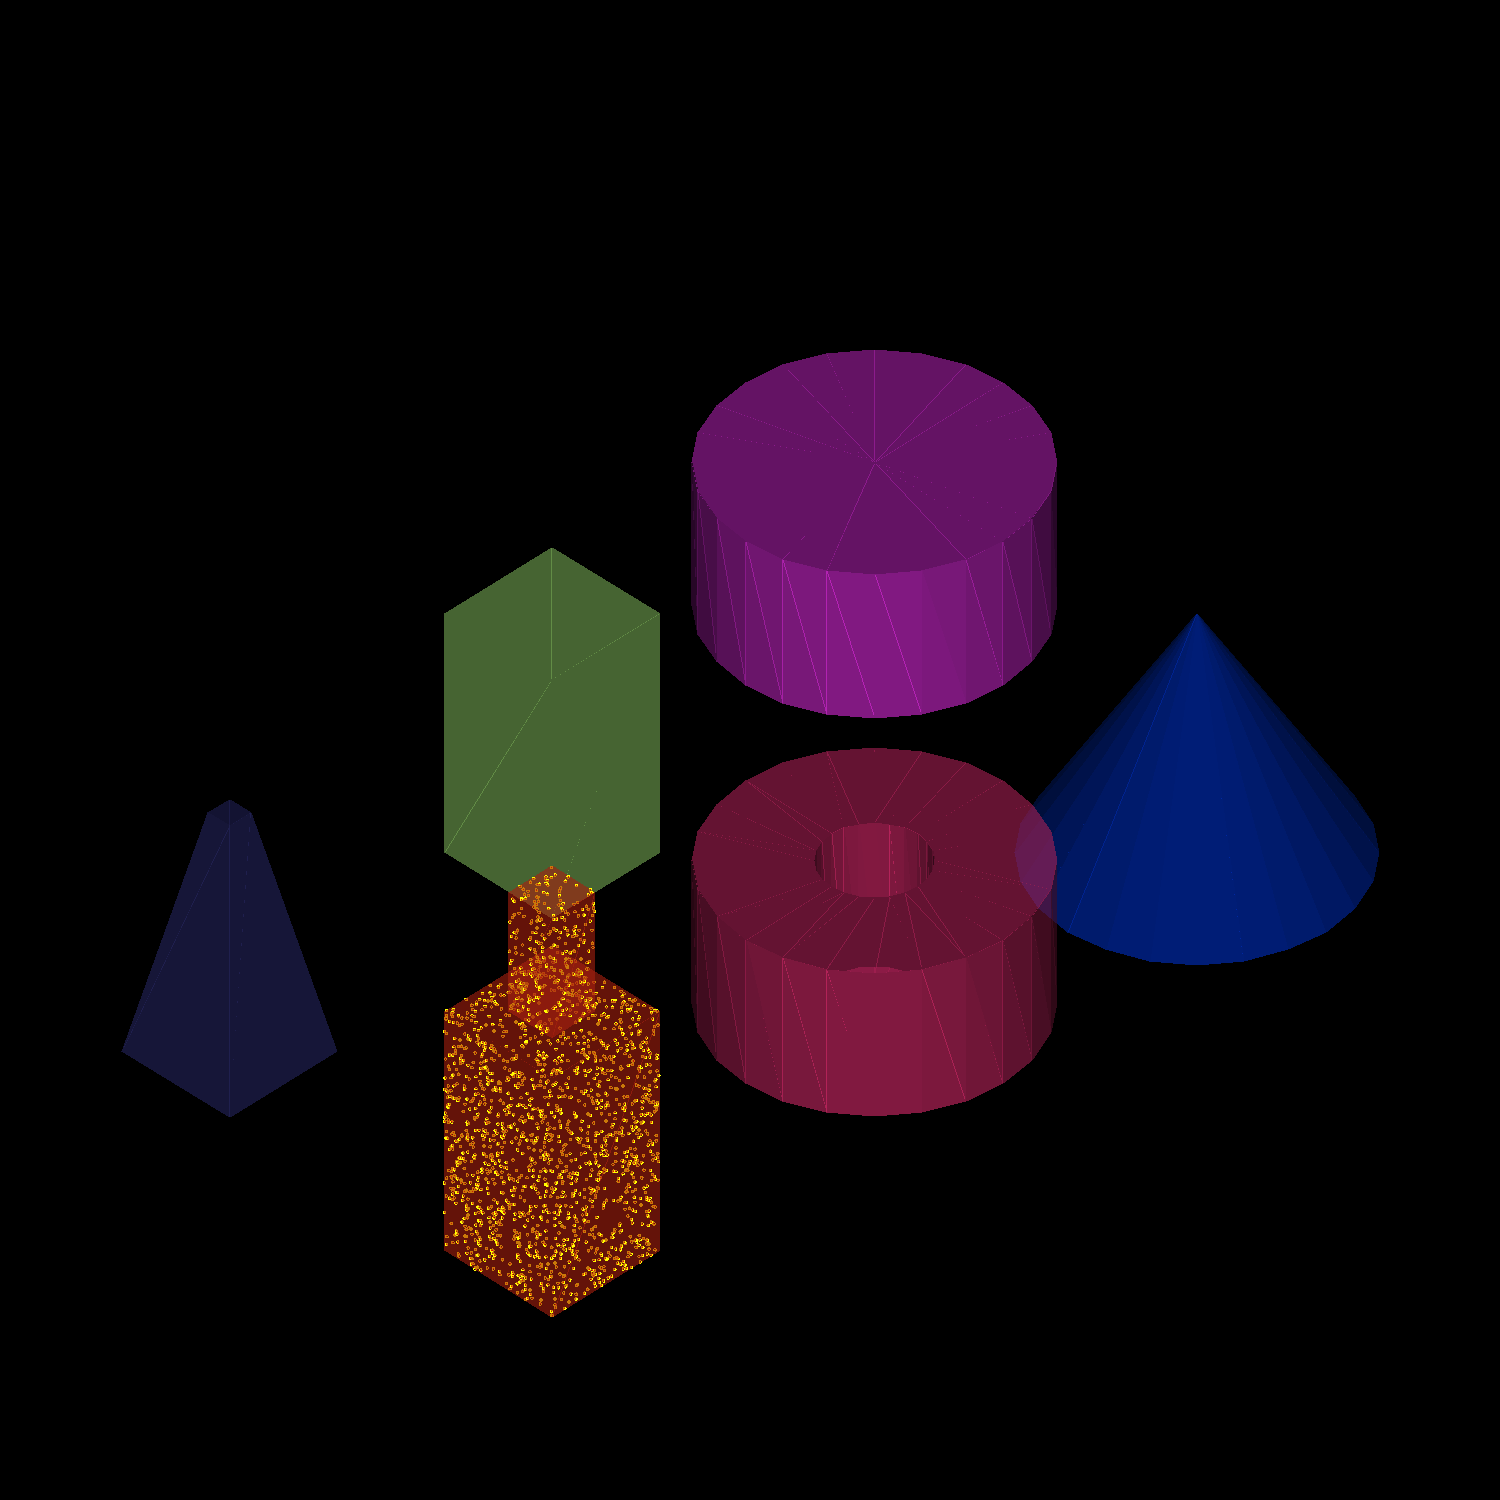
Checks on sampling for daughters with solids.
The left cube consists of two nested cubes, from both is sampled from.
The two cubes should have the same apparent point density; they should not be concentrated on the outer layer on the left cube.
Generic surface sampling
remage has a dedicated algorithm for sampling points on the surface of any solid. The next section of the validation report provides tests on the intermediate steps of this algorithm and on the final result.
Bounding sphere
The surface sampling algorithm requires a bounding sphere containing the solid. Points are then generated outside this bounding sphere, and based on a random direction the number of intersections is computed.
The following figures show the bounding sphere and initial points (which should be outside the bounding sphere). You should see that the grey bounding spheres are large enough to contain the green solids and that the red points all lie outside the grey box.

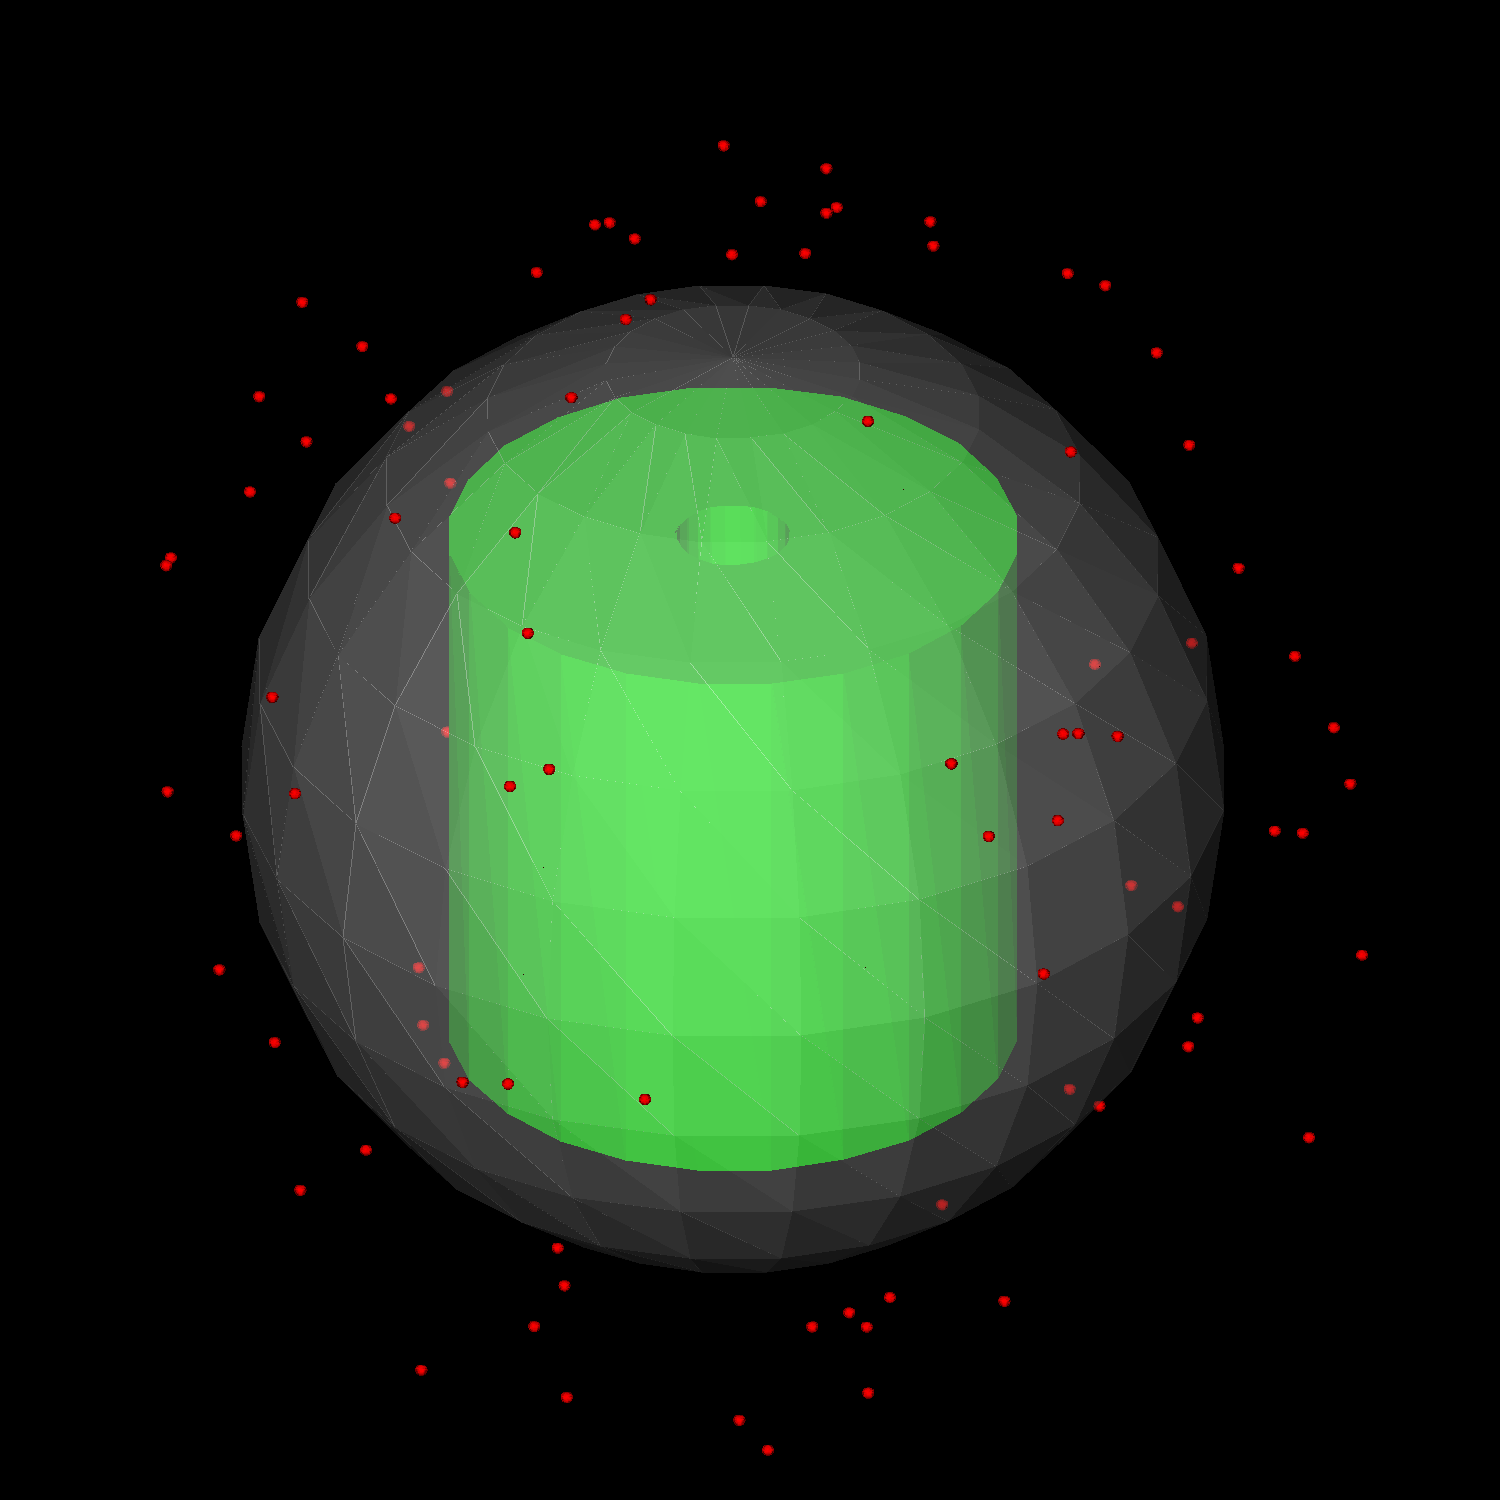
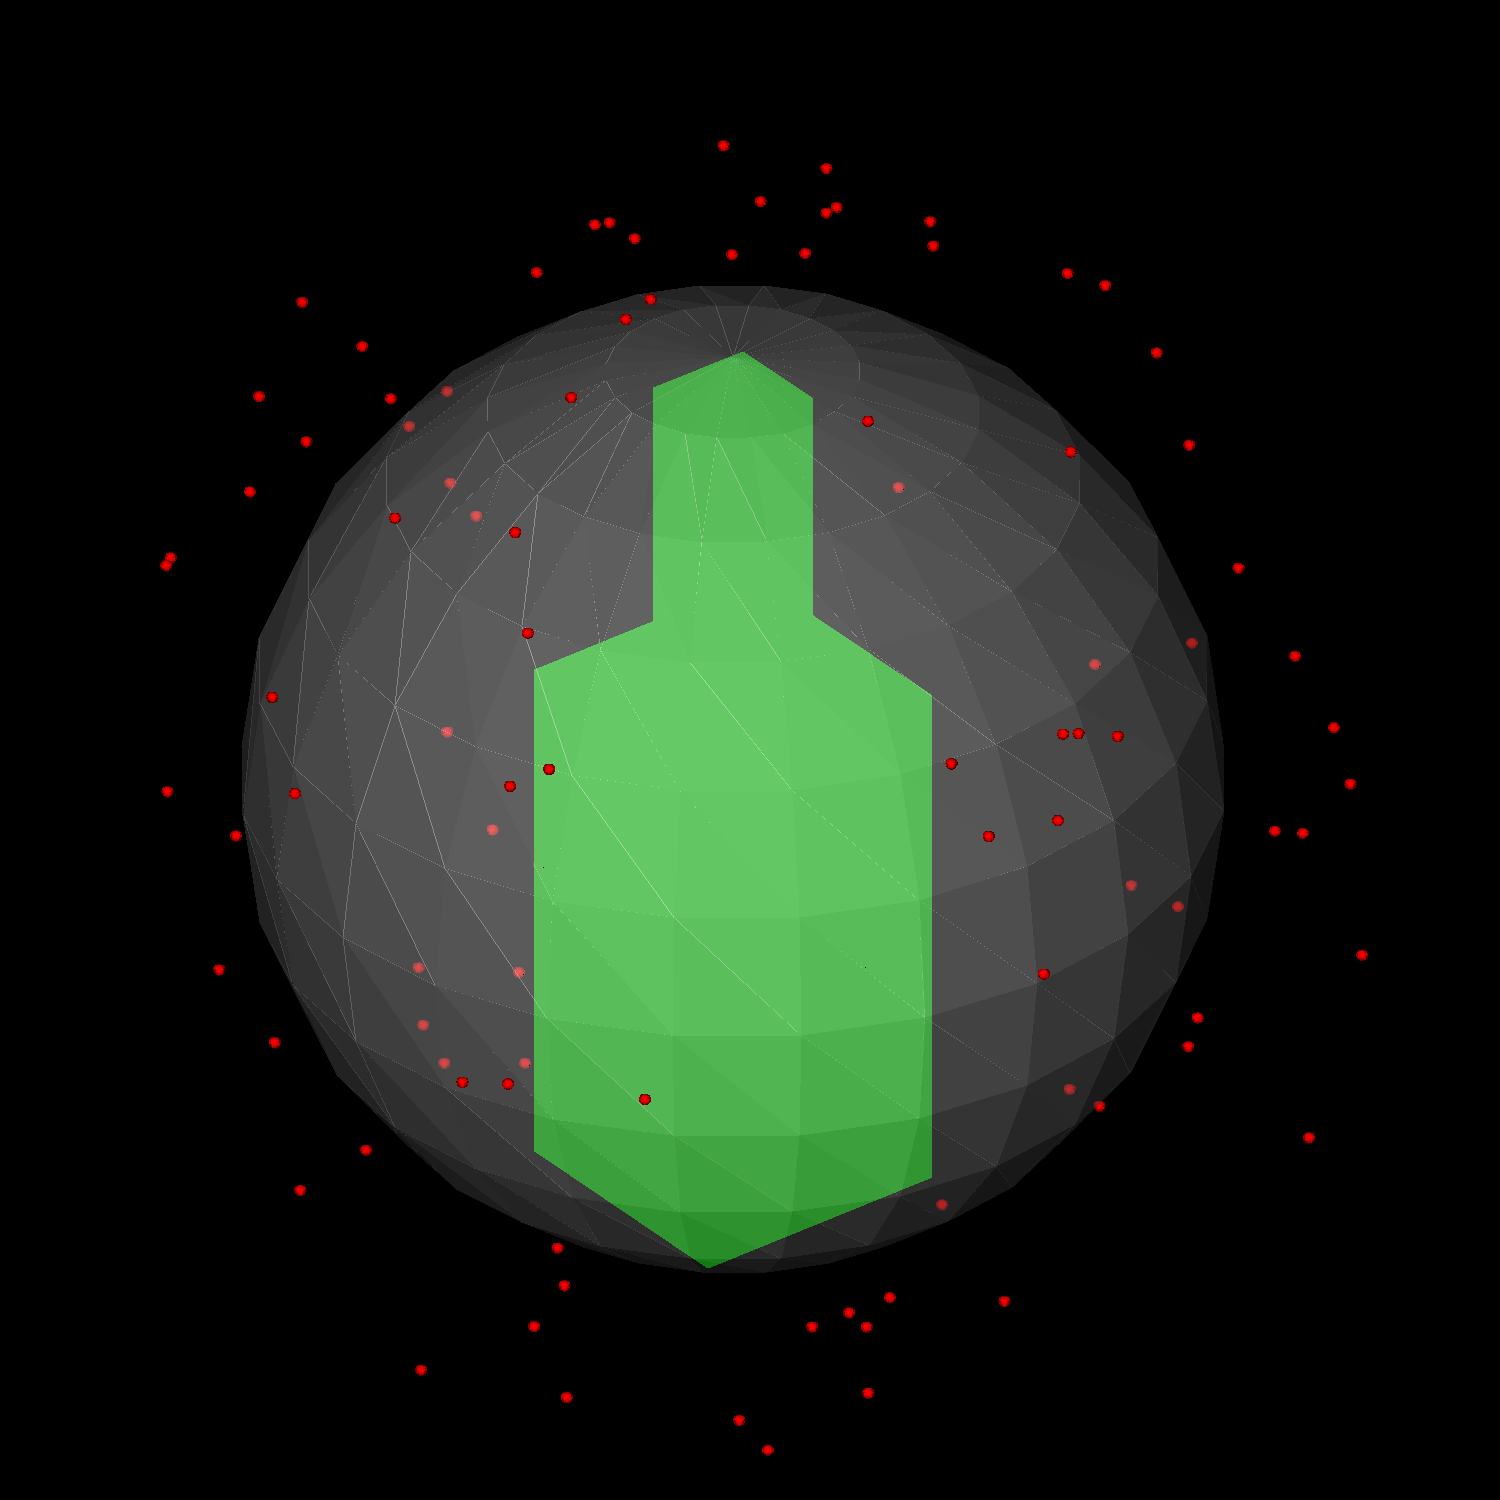
Checks on the bounding spheres.
Location of sampled vertices
The next figures show the location of generated primaries for various different solids. You should see the primaries are contained in the appropriate solid and that they are distributed on the surface.
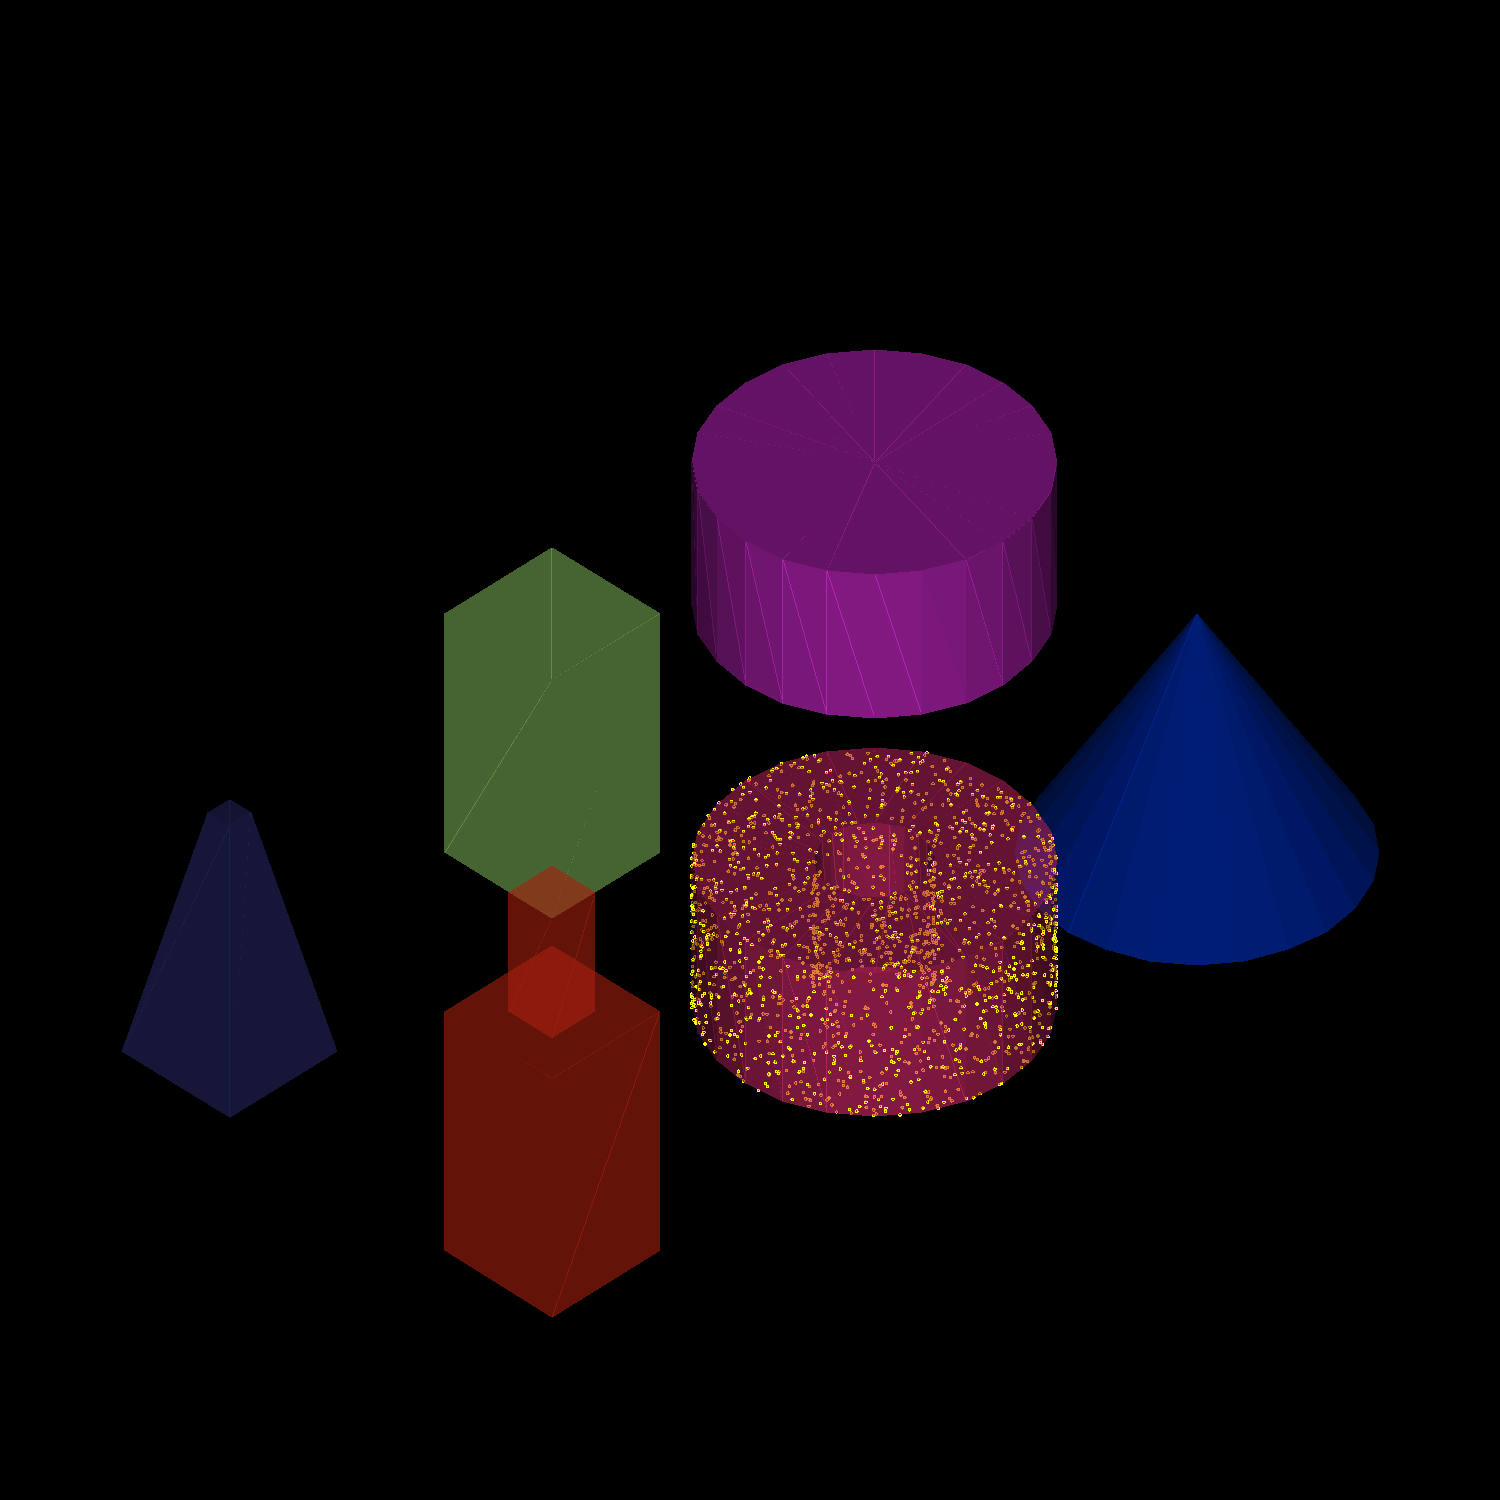
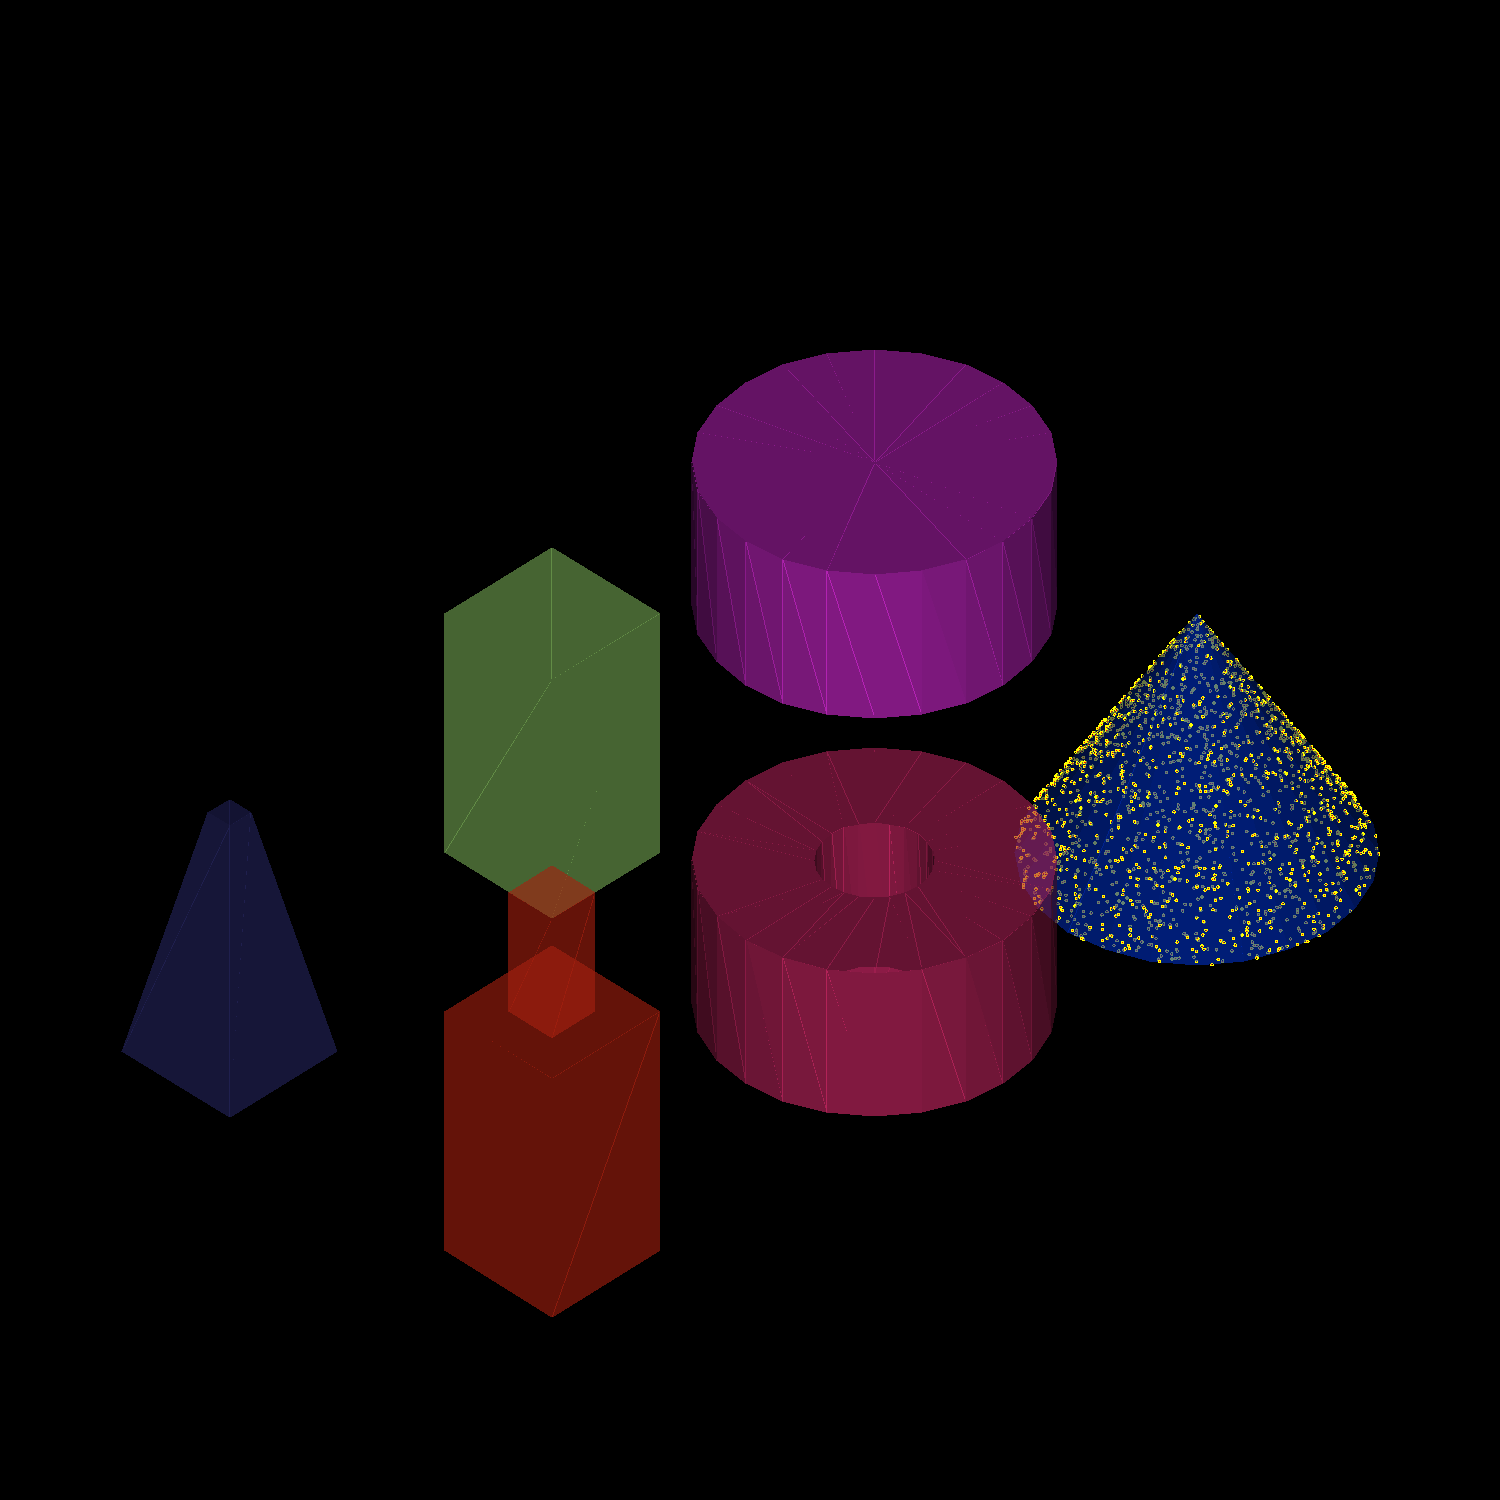
Checks on the location of vertices for surface sampling.
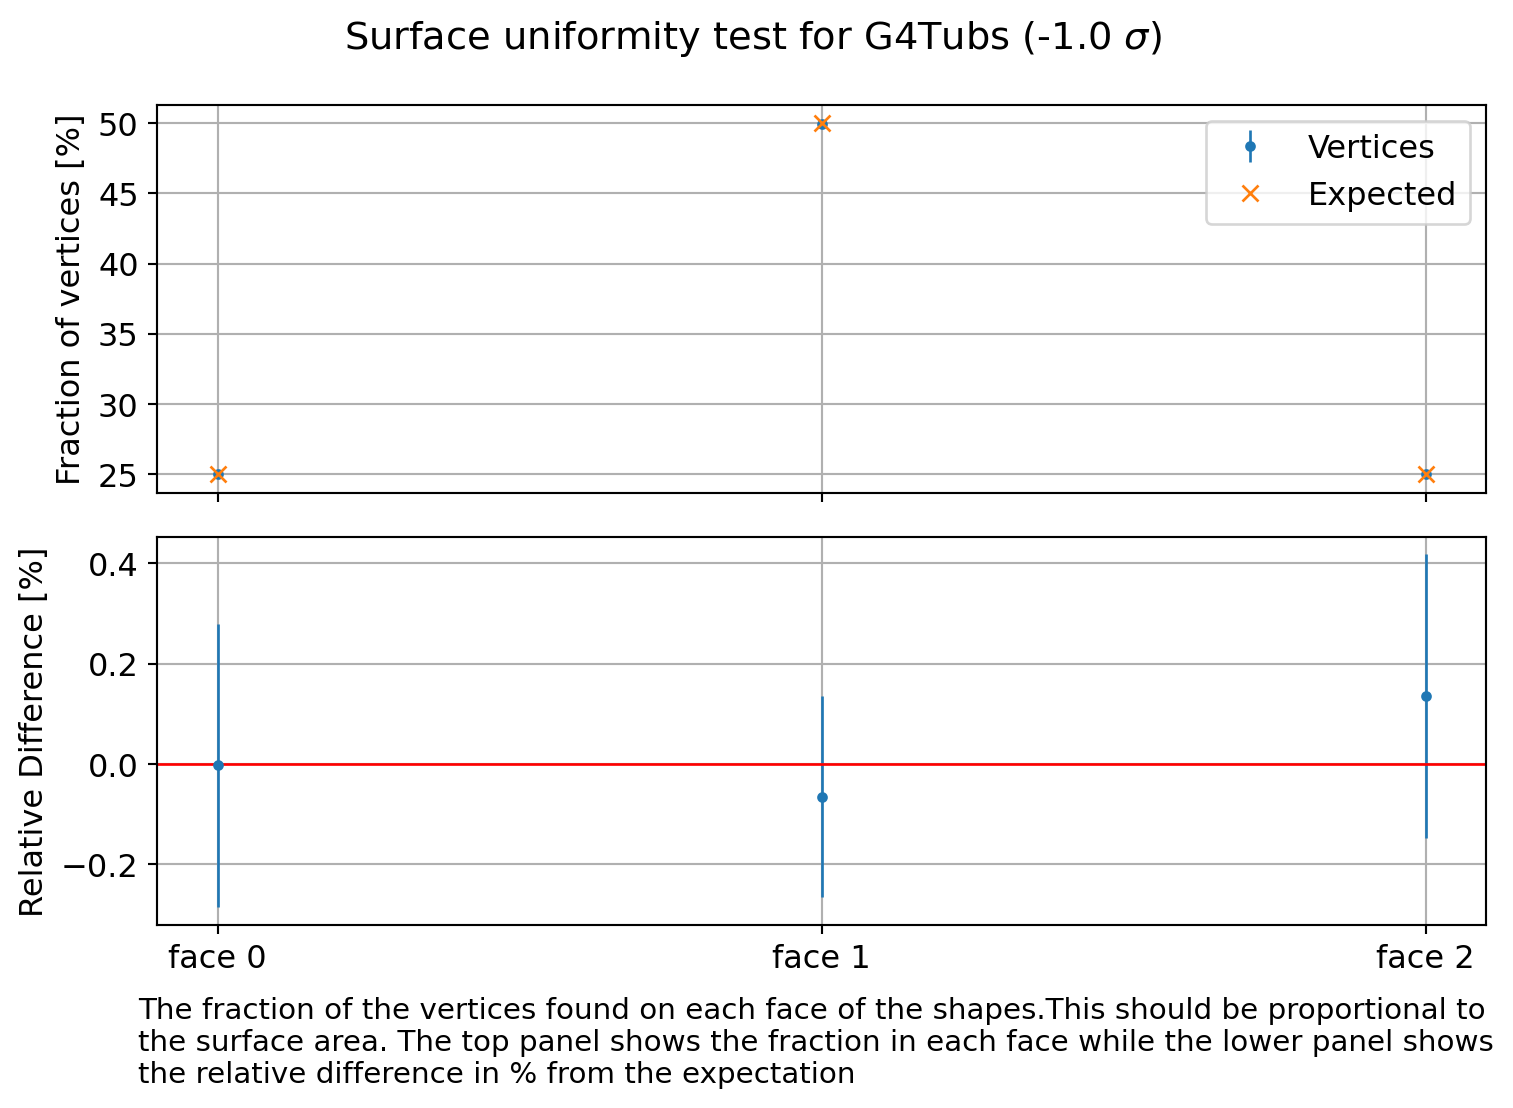
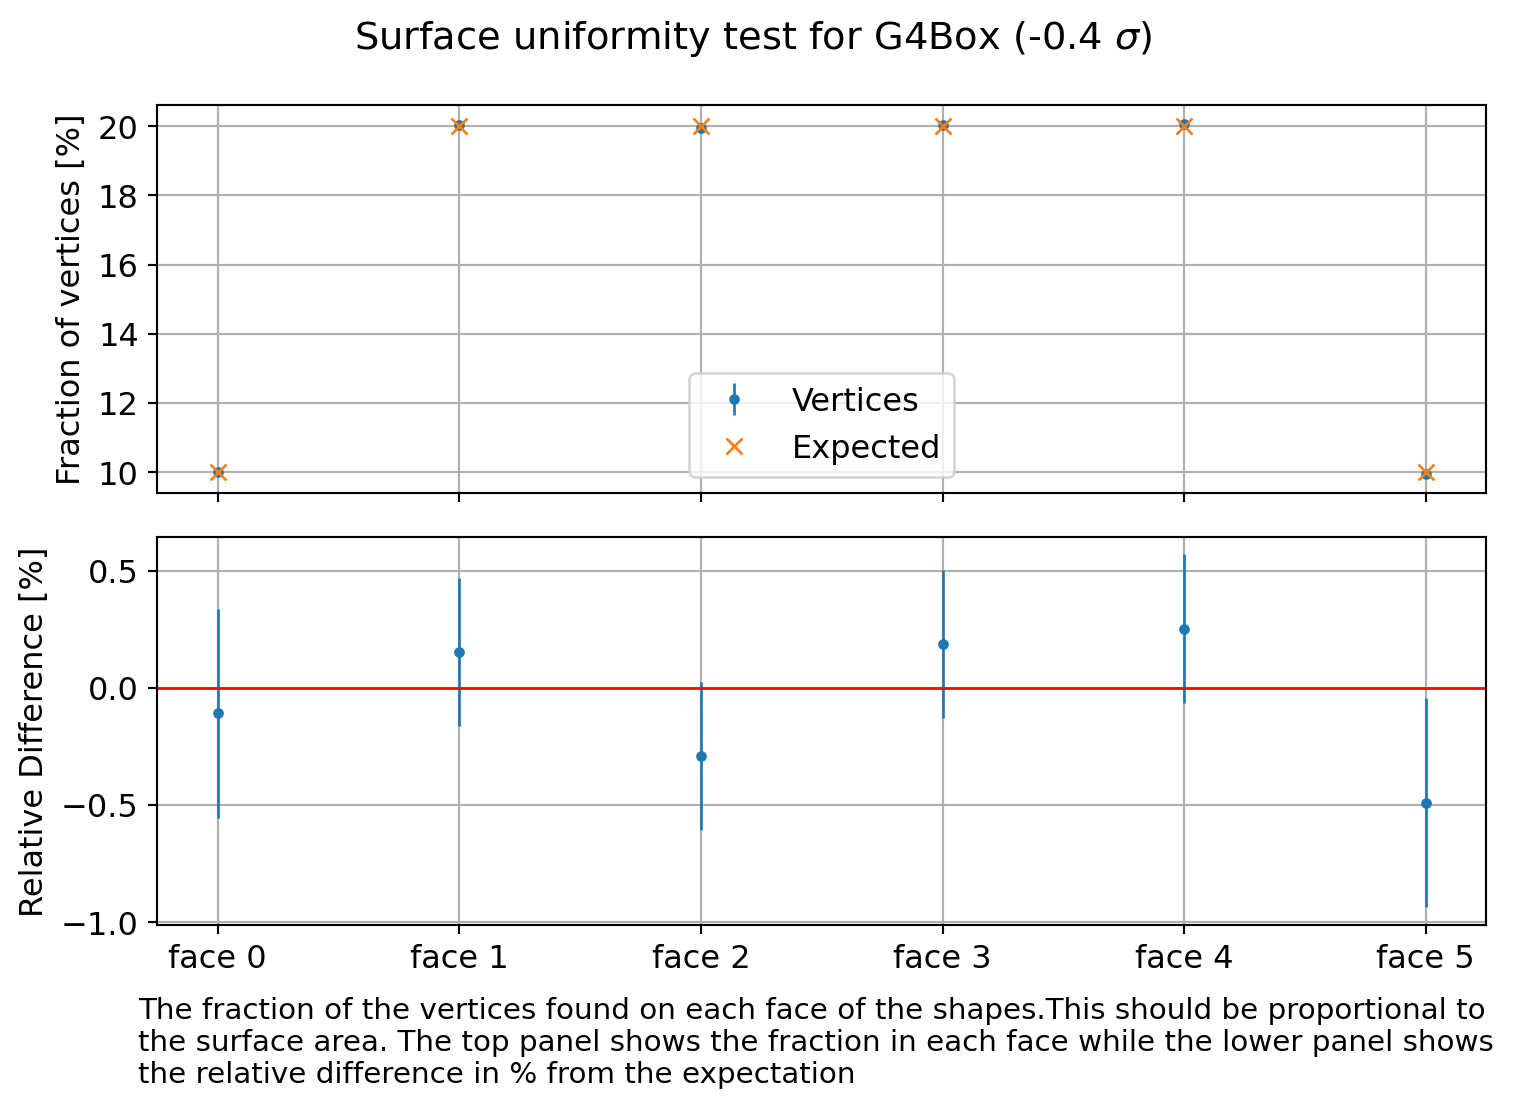
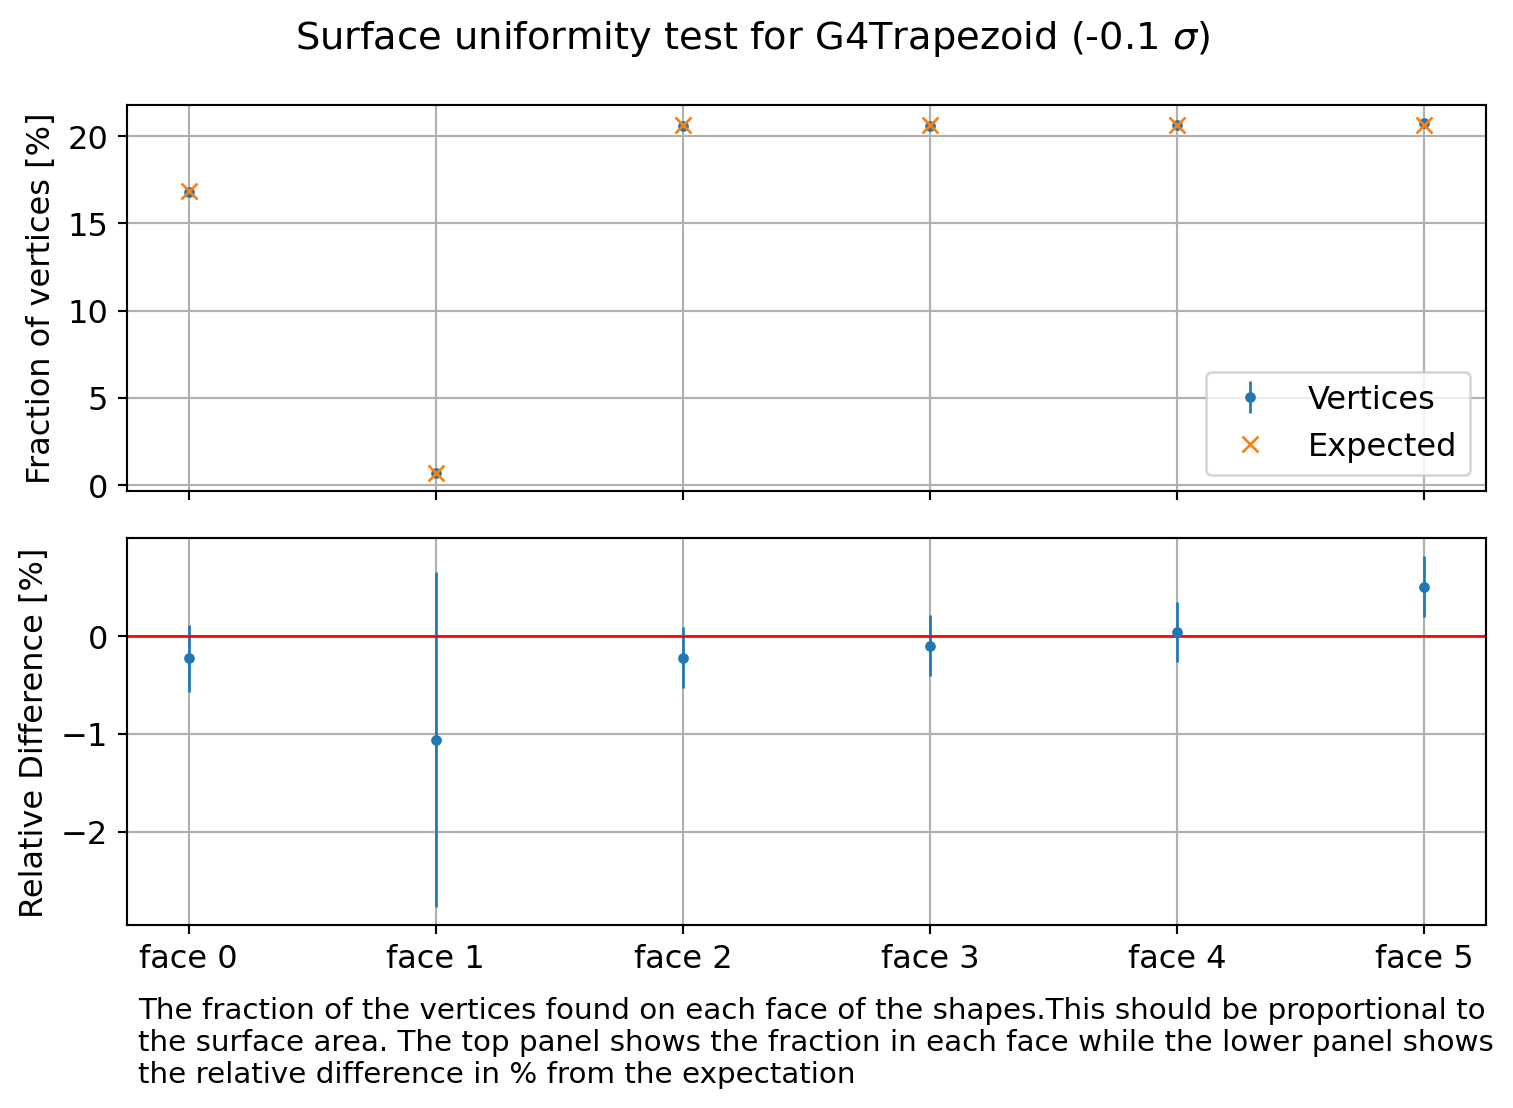
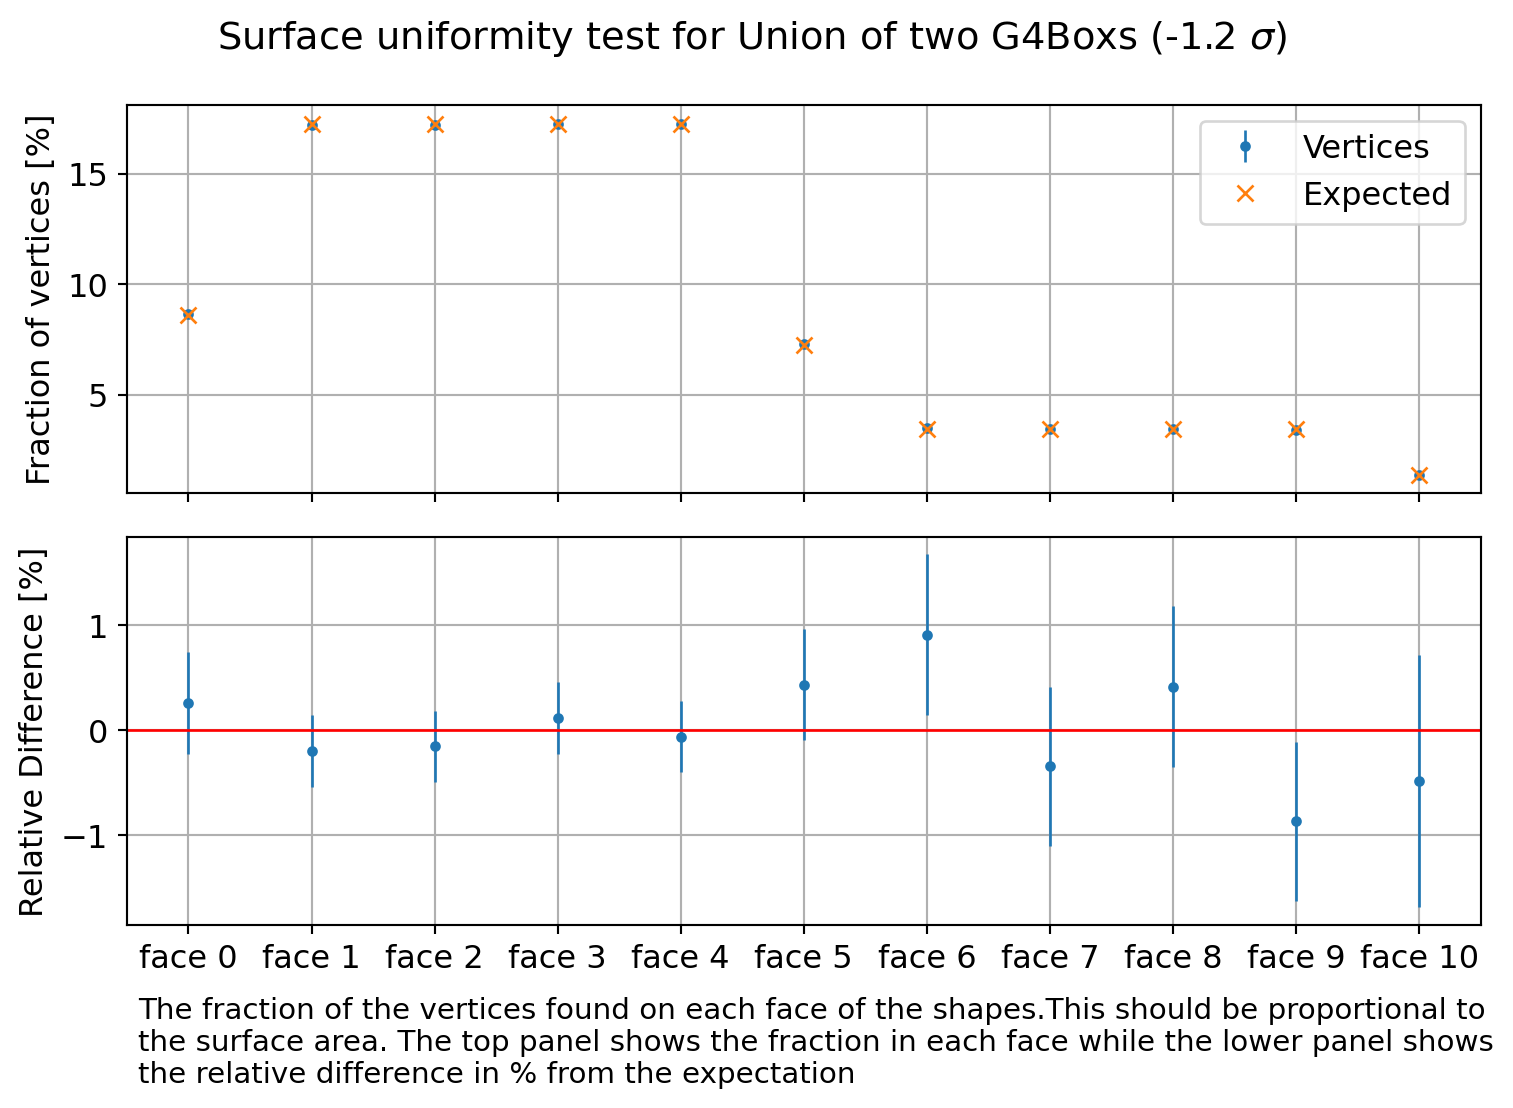
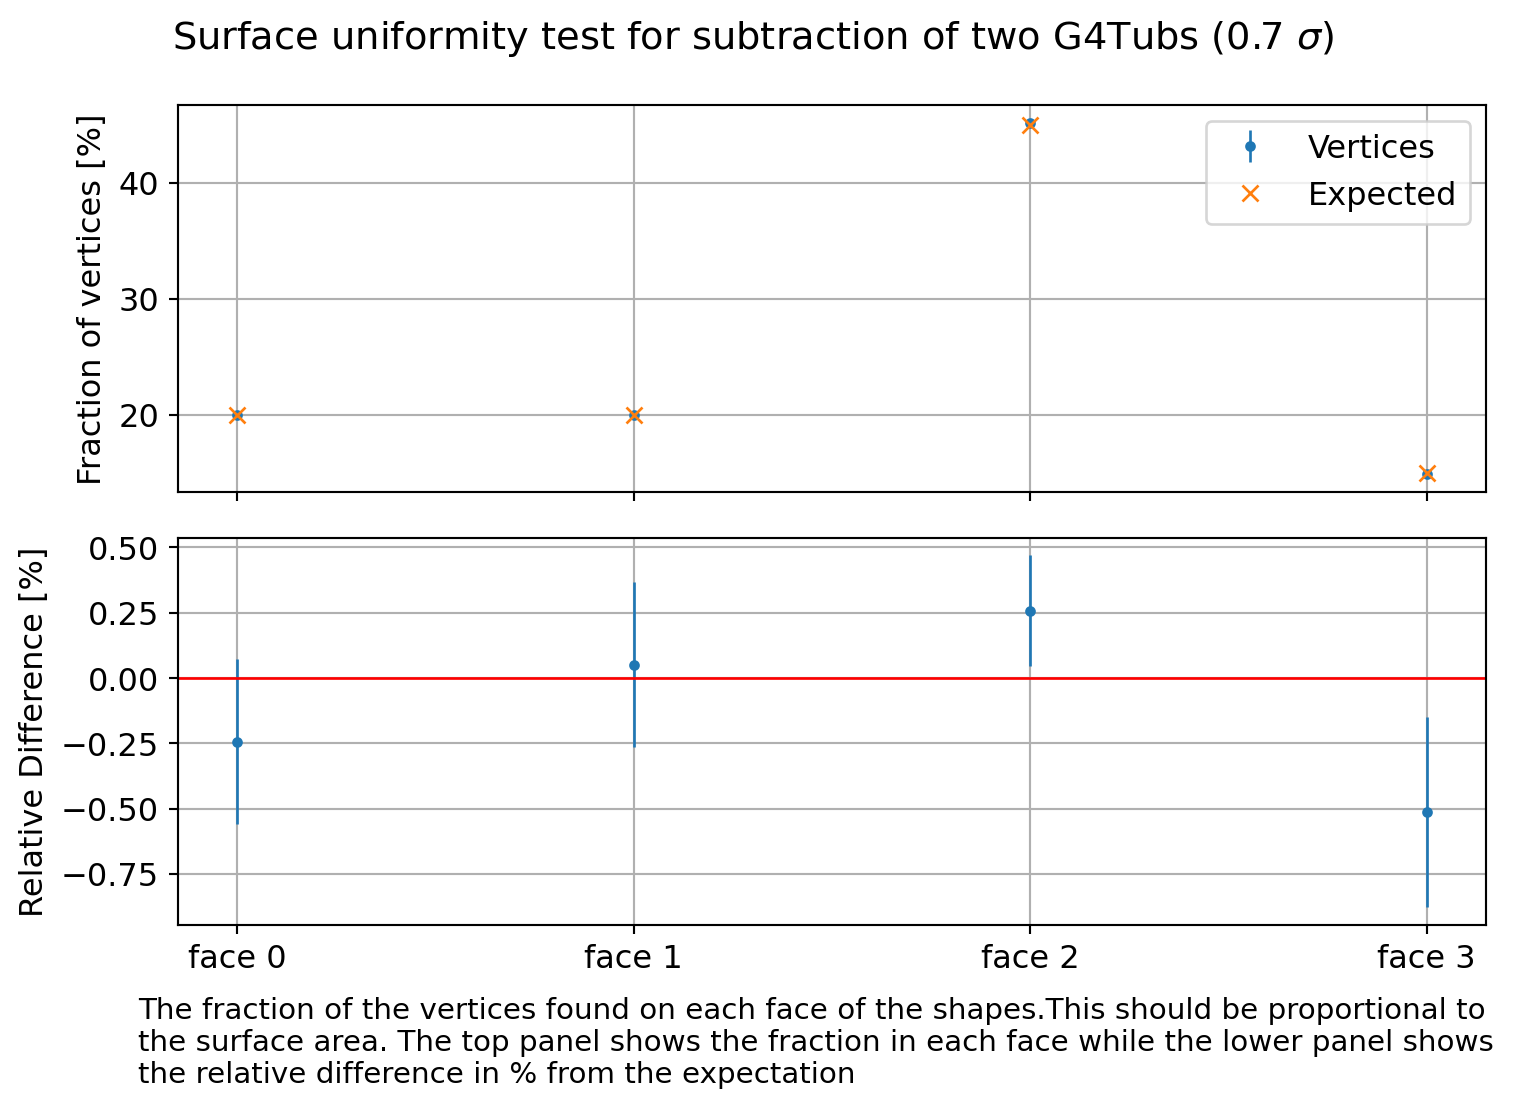
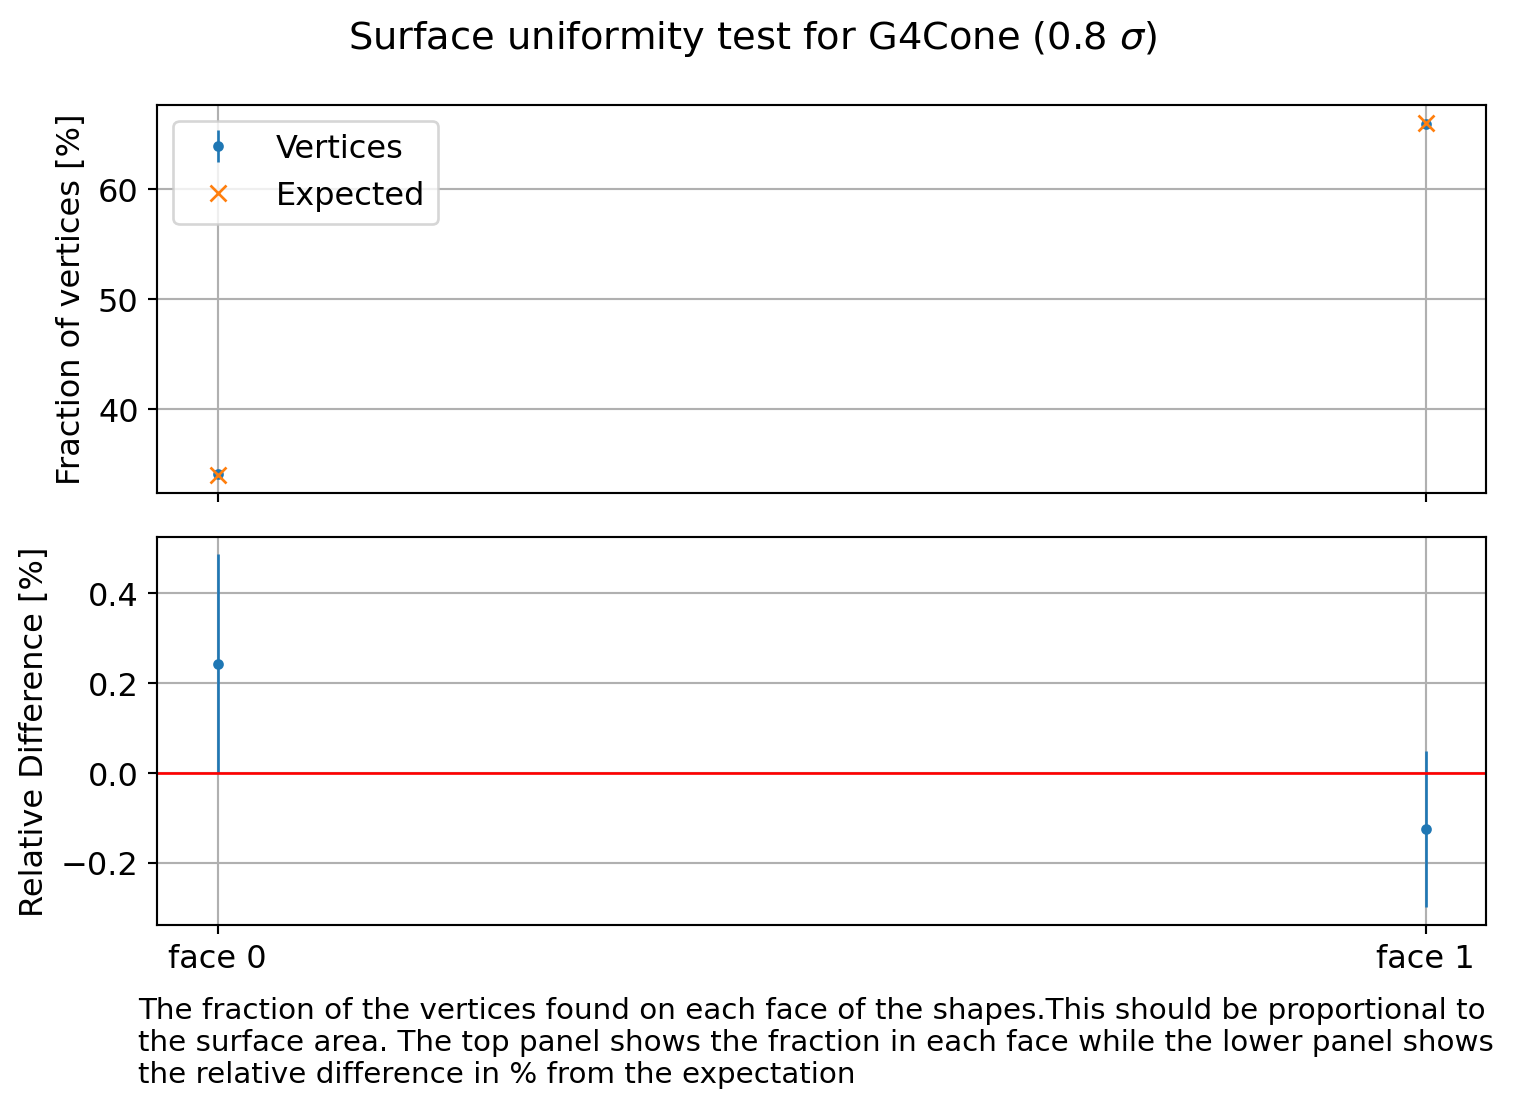
Statistical tests of uniformity
The final part of the test for the generic surface sampler is a series of statistical tests on the uniformity of the points on the surface of the shapes. This is based on counting the number of primaries on each face of the solids and comparing the ratio to that of the surface areas. The tests are based on the same simulation as in the previous section.
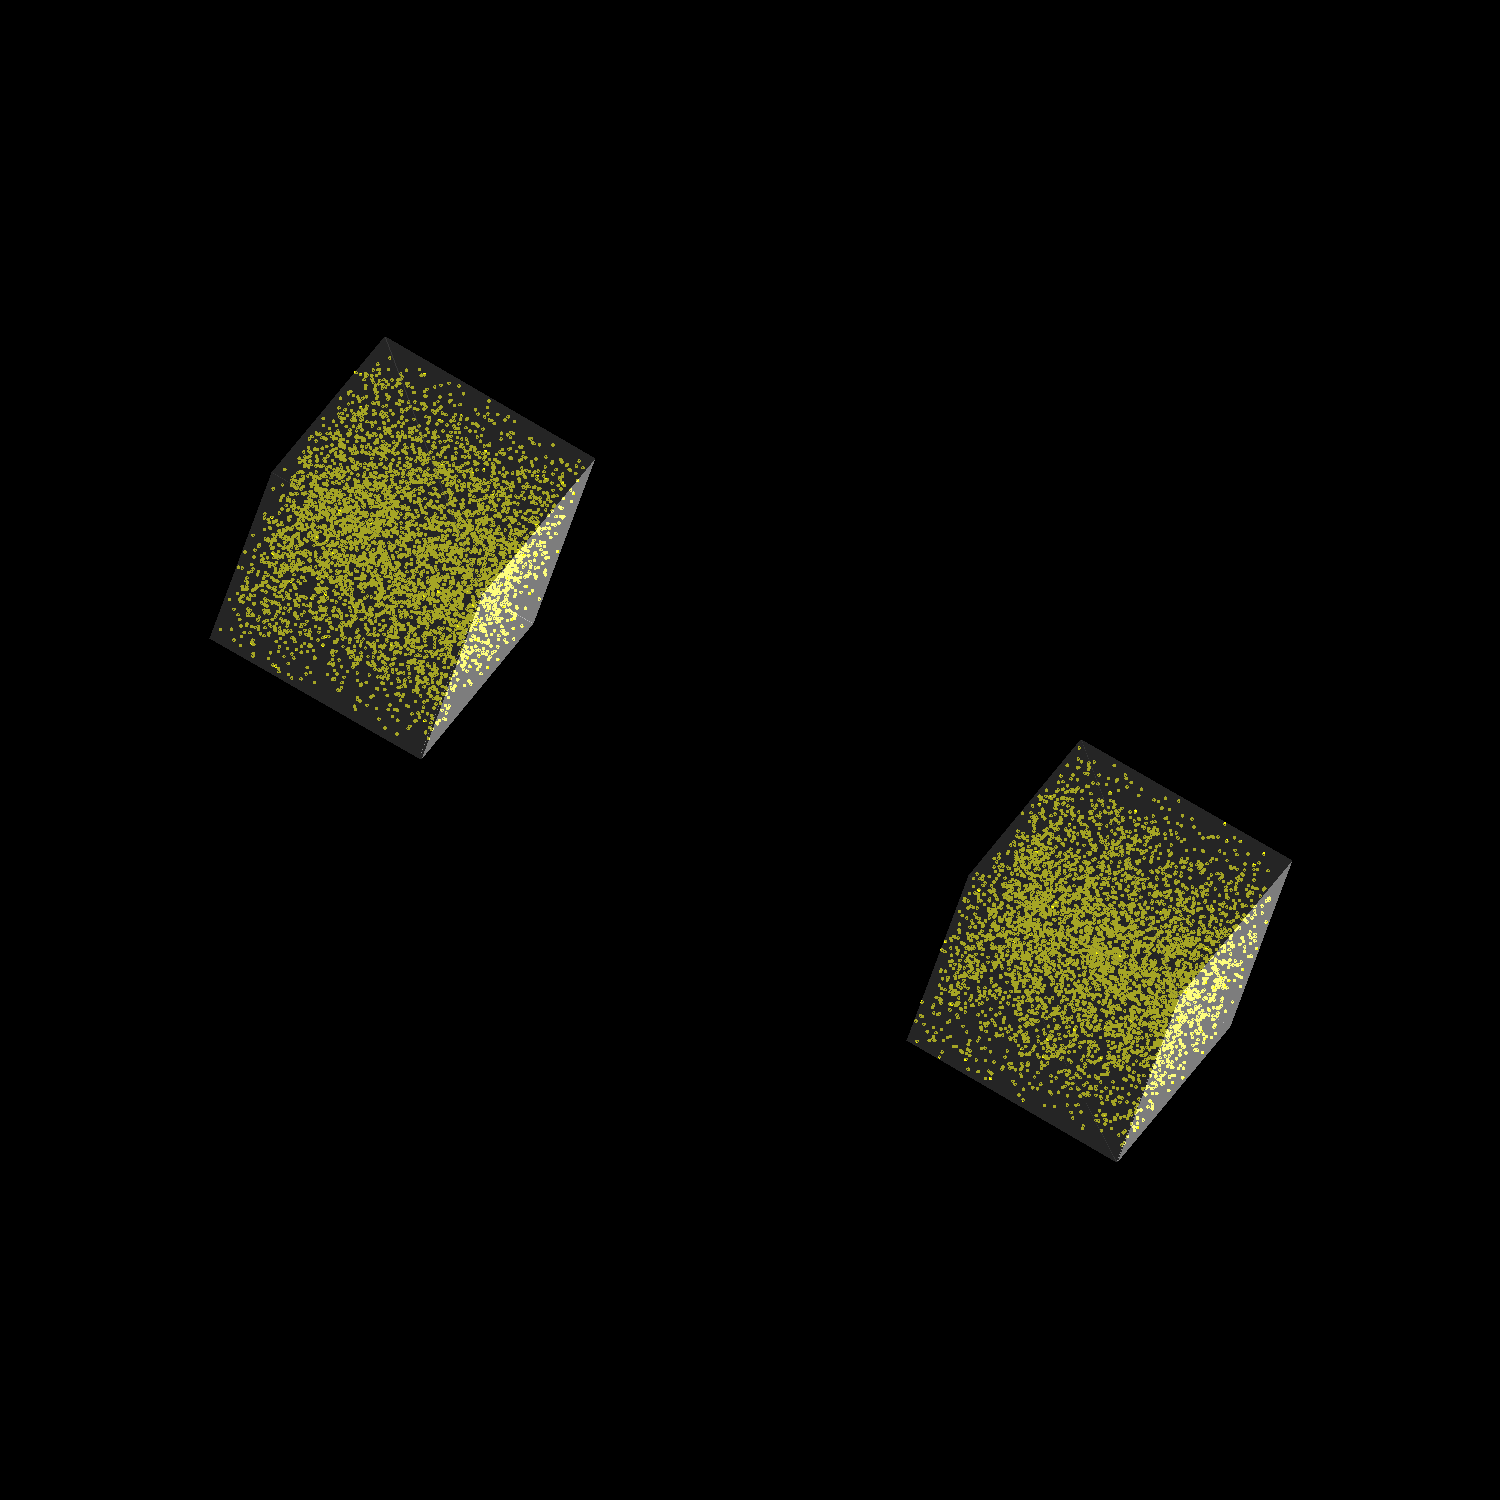
First we plot the 3D position of the vertices labelling which side the vertex is closest too by color. If a vertex is not close to any side the test will fail.
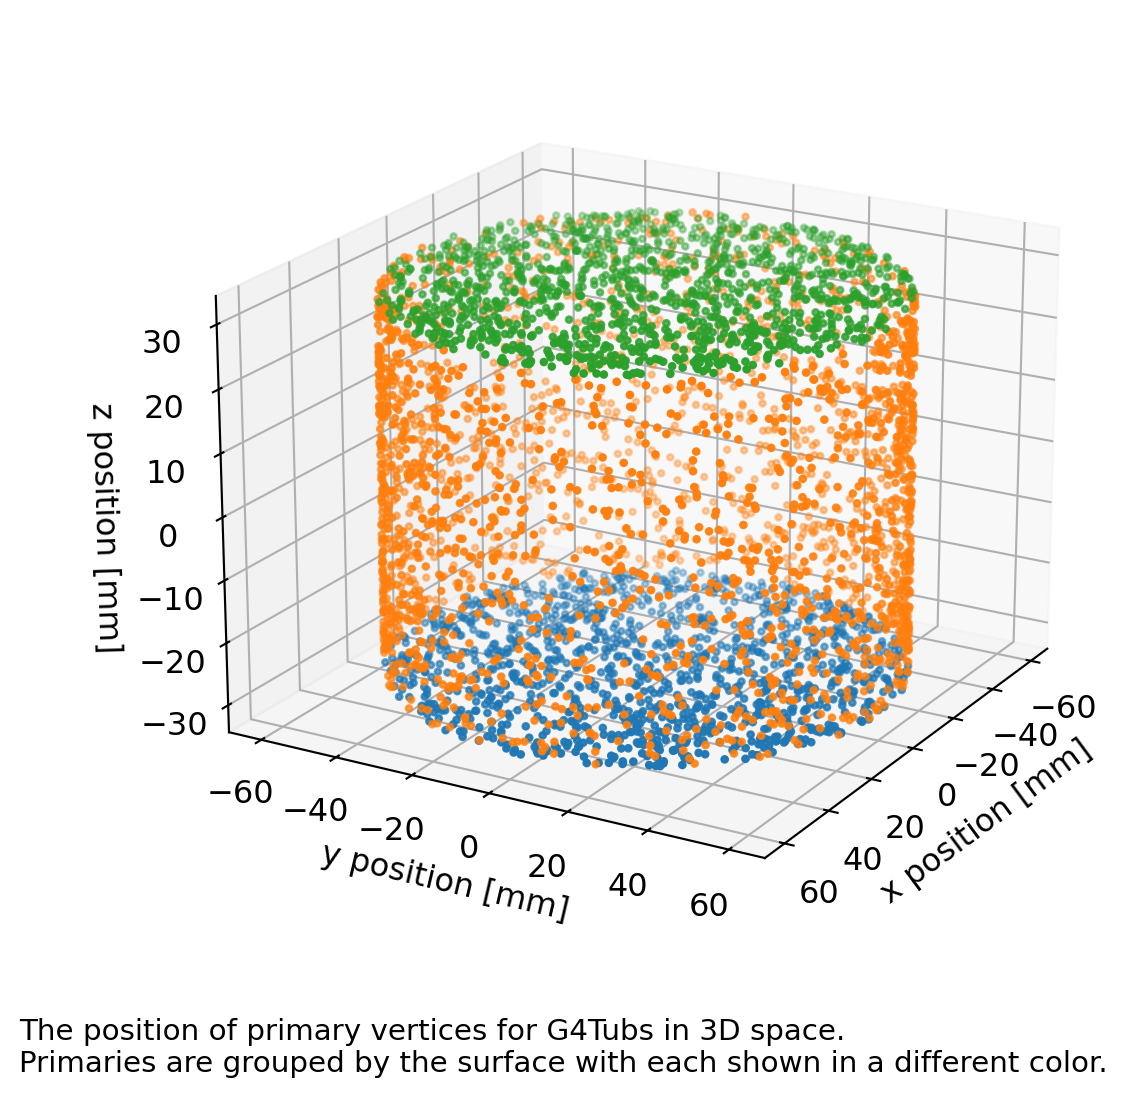
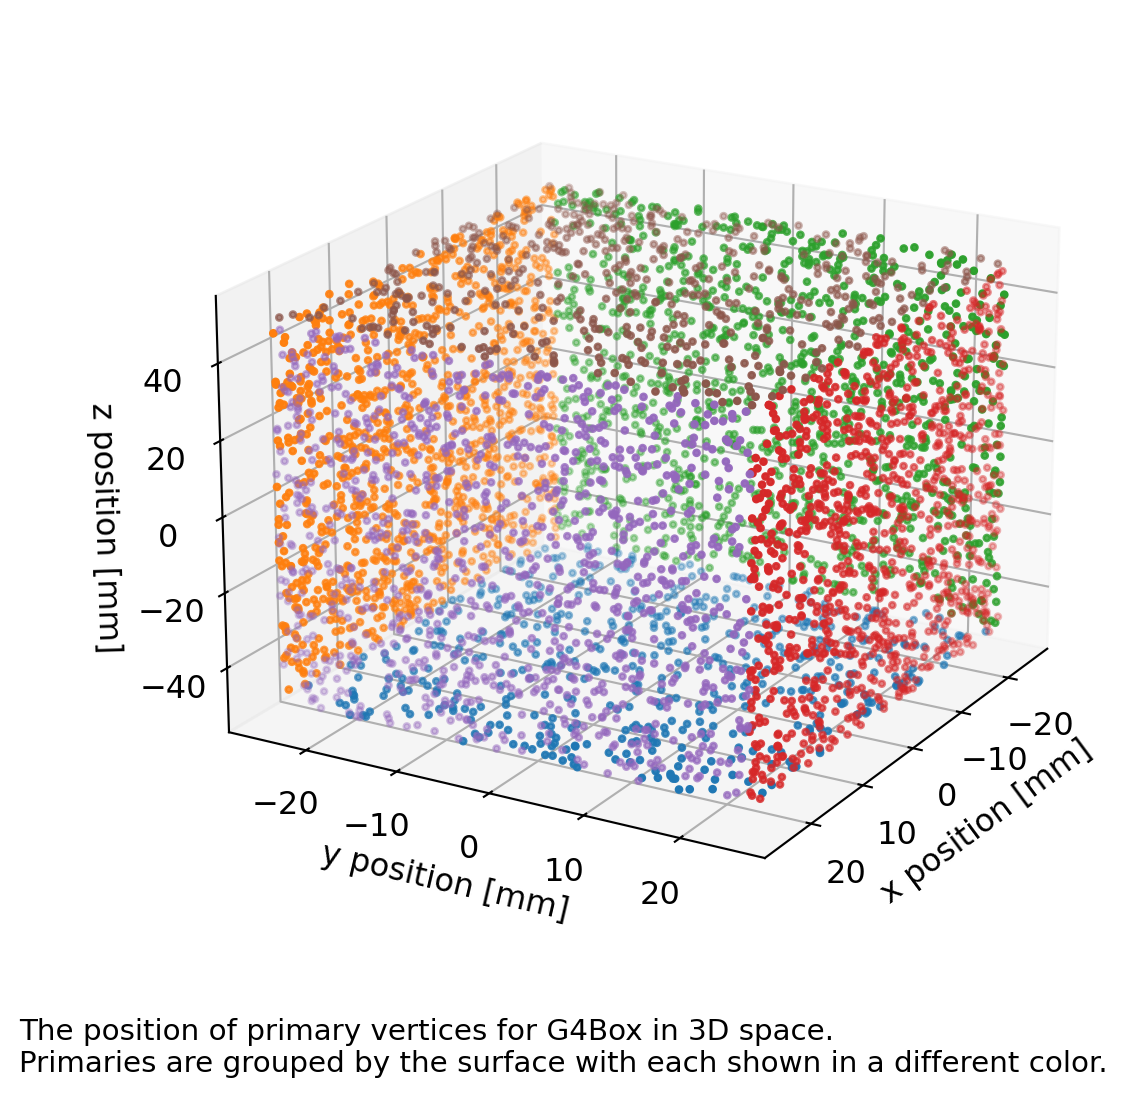
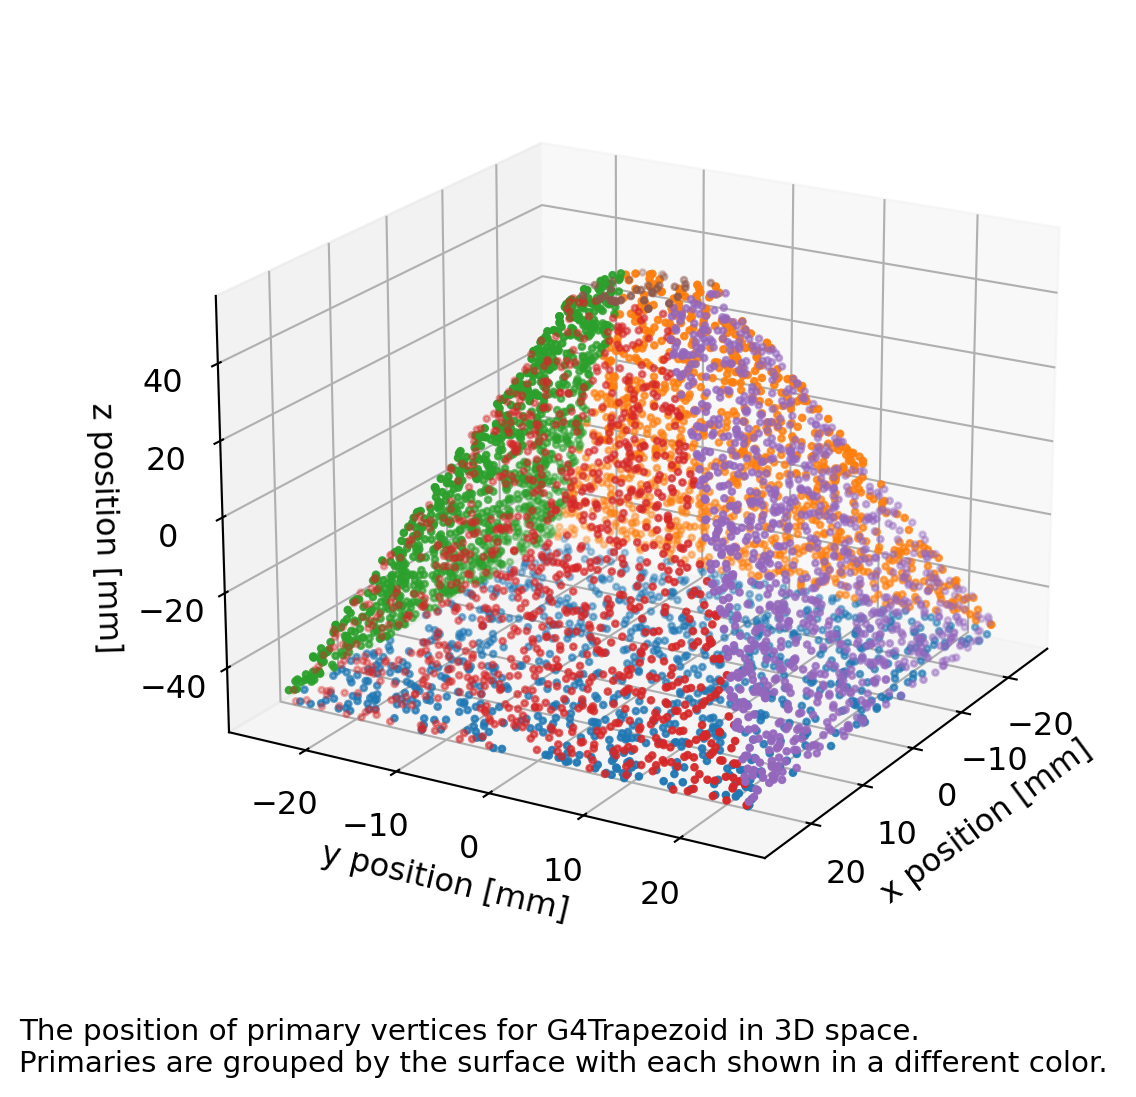
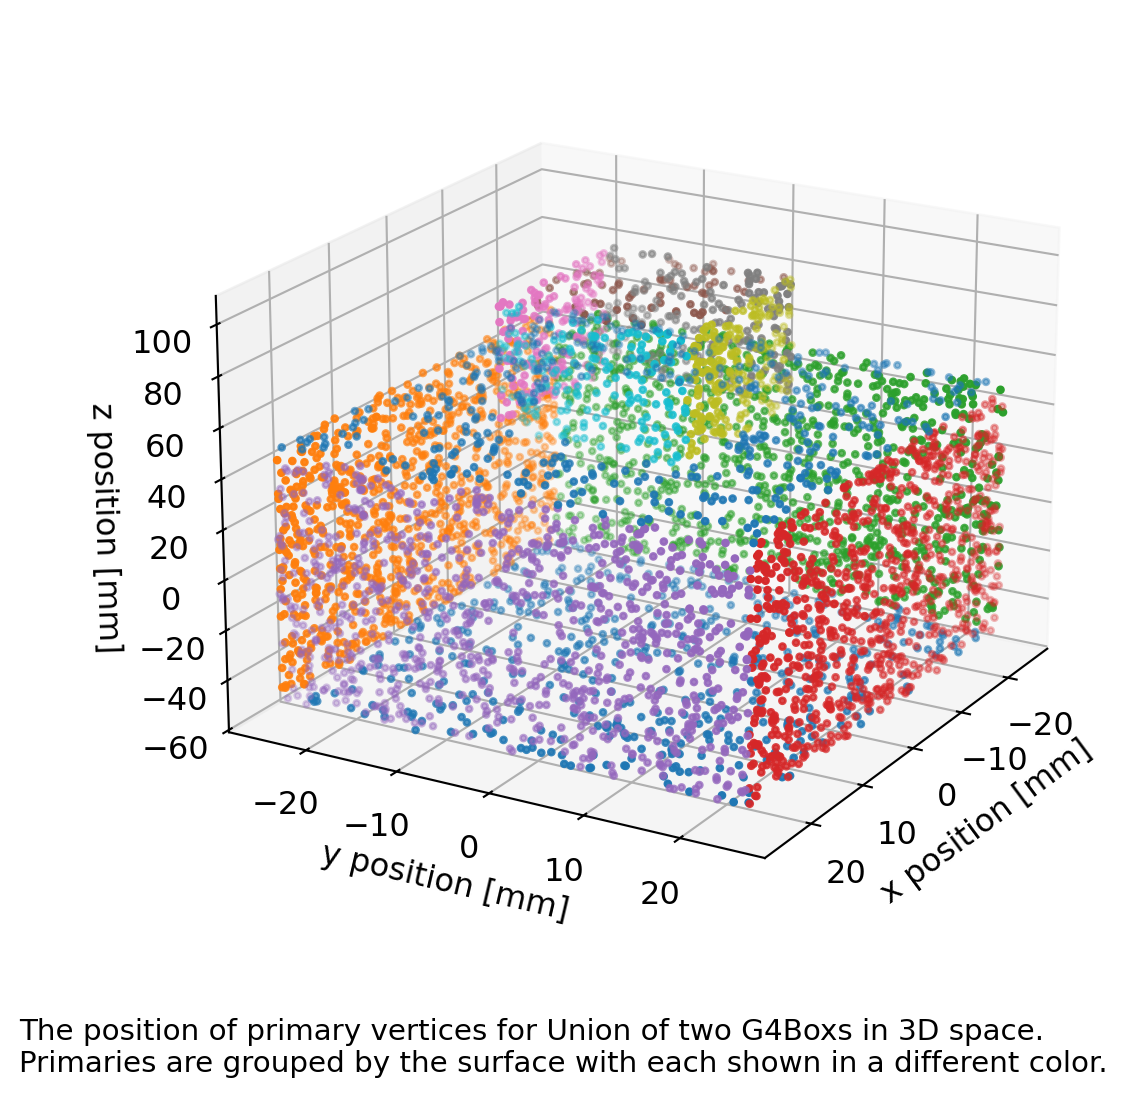
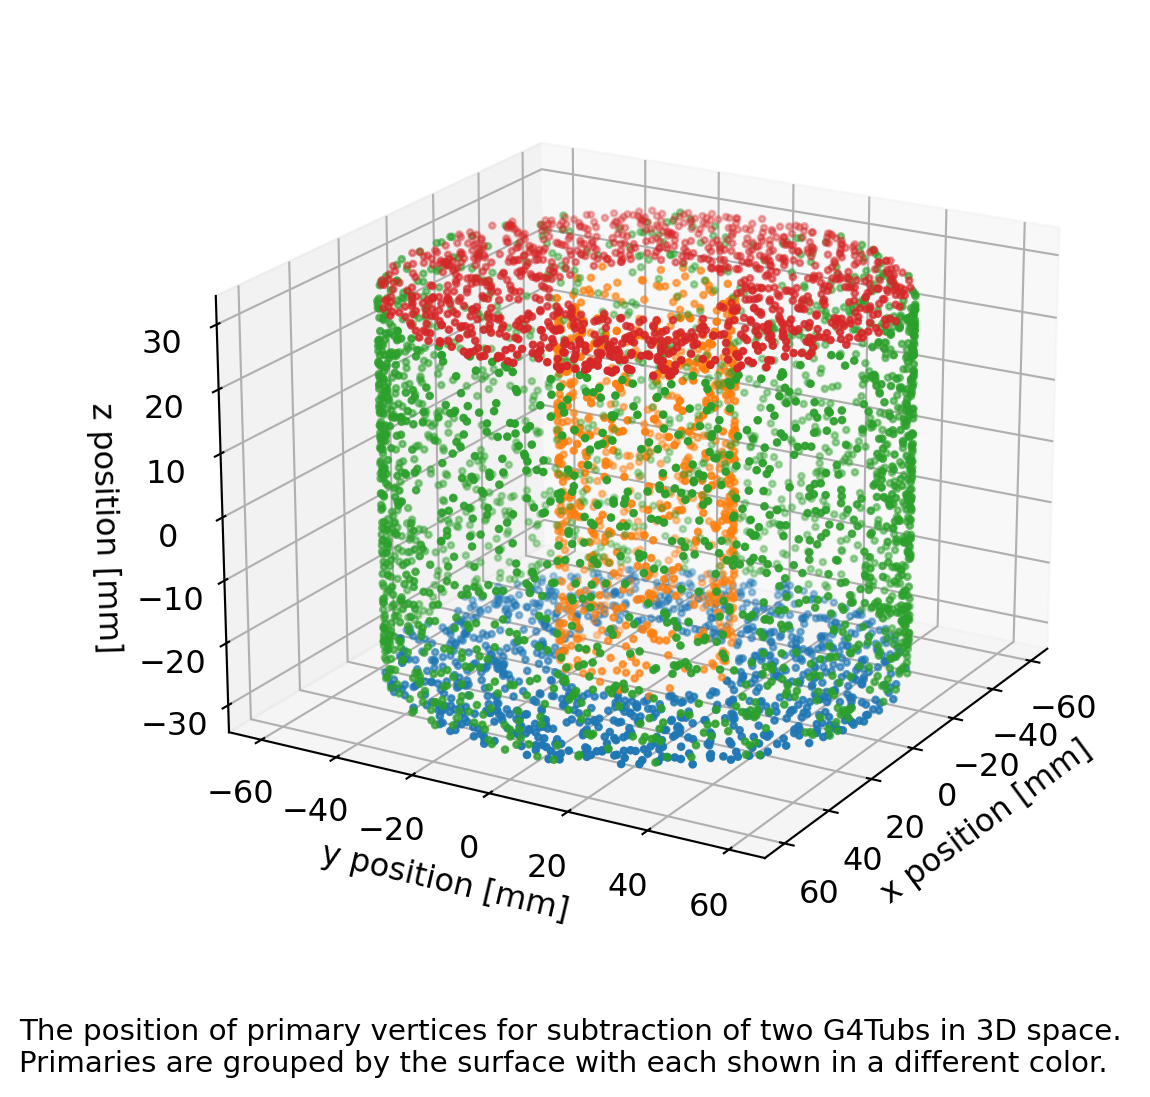
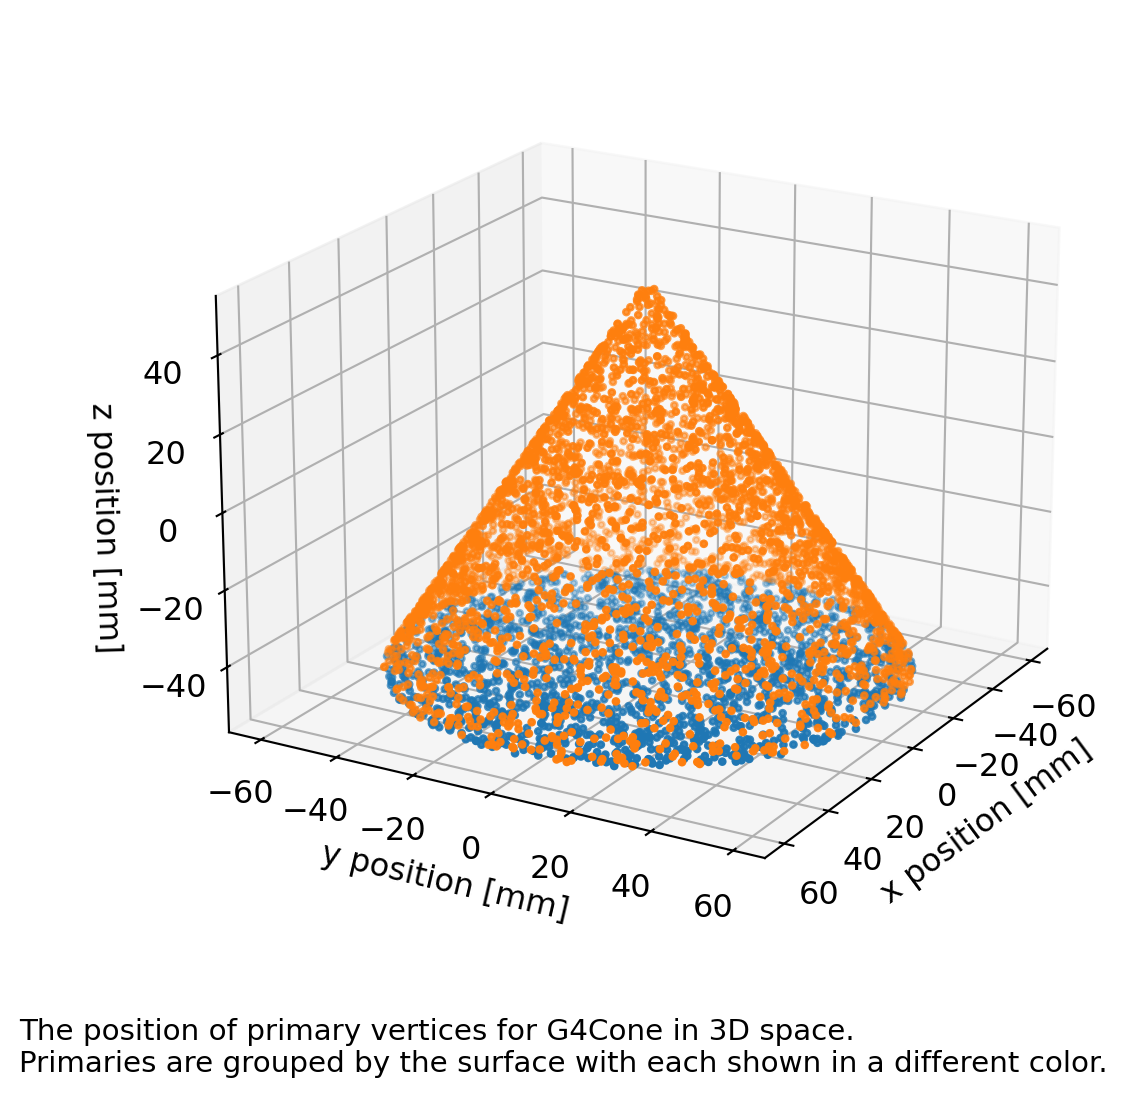
You should be able to verify that the primaries close to each surface are correctly identified and that the primaries are indeed distributed on a surface.
Finally, we perform the statistical tests comparing the ratio of primaries on each surface to the ratio of surface area. You should see only statistical fluctuations.
Depth profiles
When sampling on a surface, remage can displace each vertex inward into the material by a depth drawn from a configurable distribution (exponential, uniform or truncated Gaussian). This models sub-surface contamination. These tests sample on the surface of a large cube and reconstruct the inward depth of each vertex (its distance to the nearest face).
The following figures compare the reconstructed depth distribution to the configured probability density for each supported profile. Only vertices near the centre of a face are used, so that the over-counting at edges and corners does not bias the spectrum. You should see the sampled histogram follow the overlaid theoretical curve, with only statistical fluctuations.
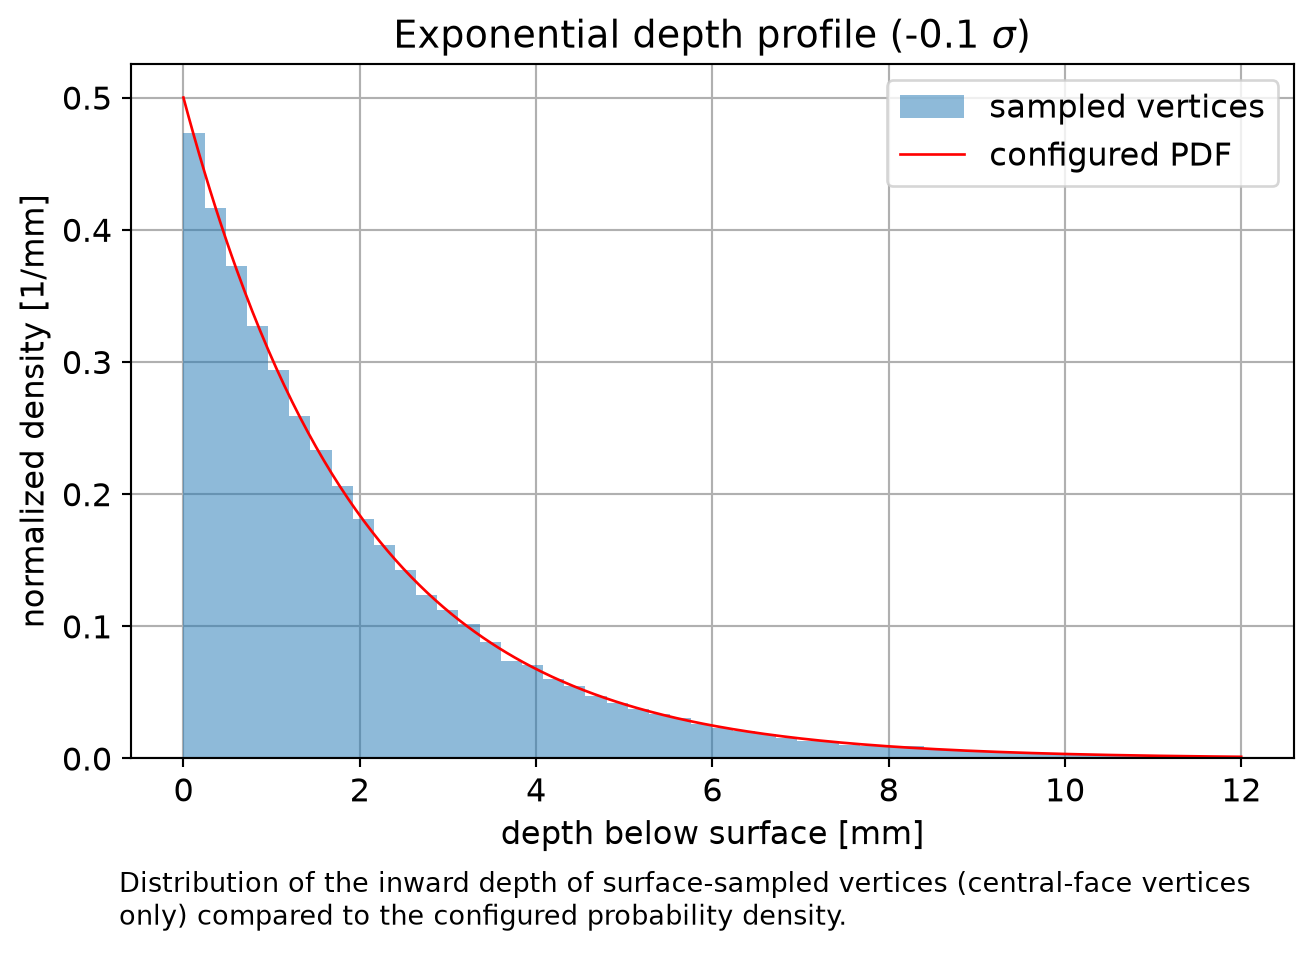
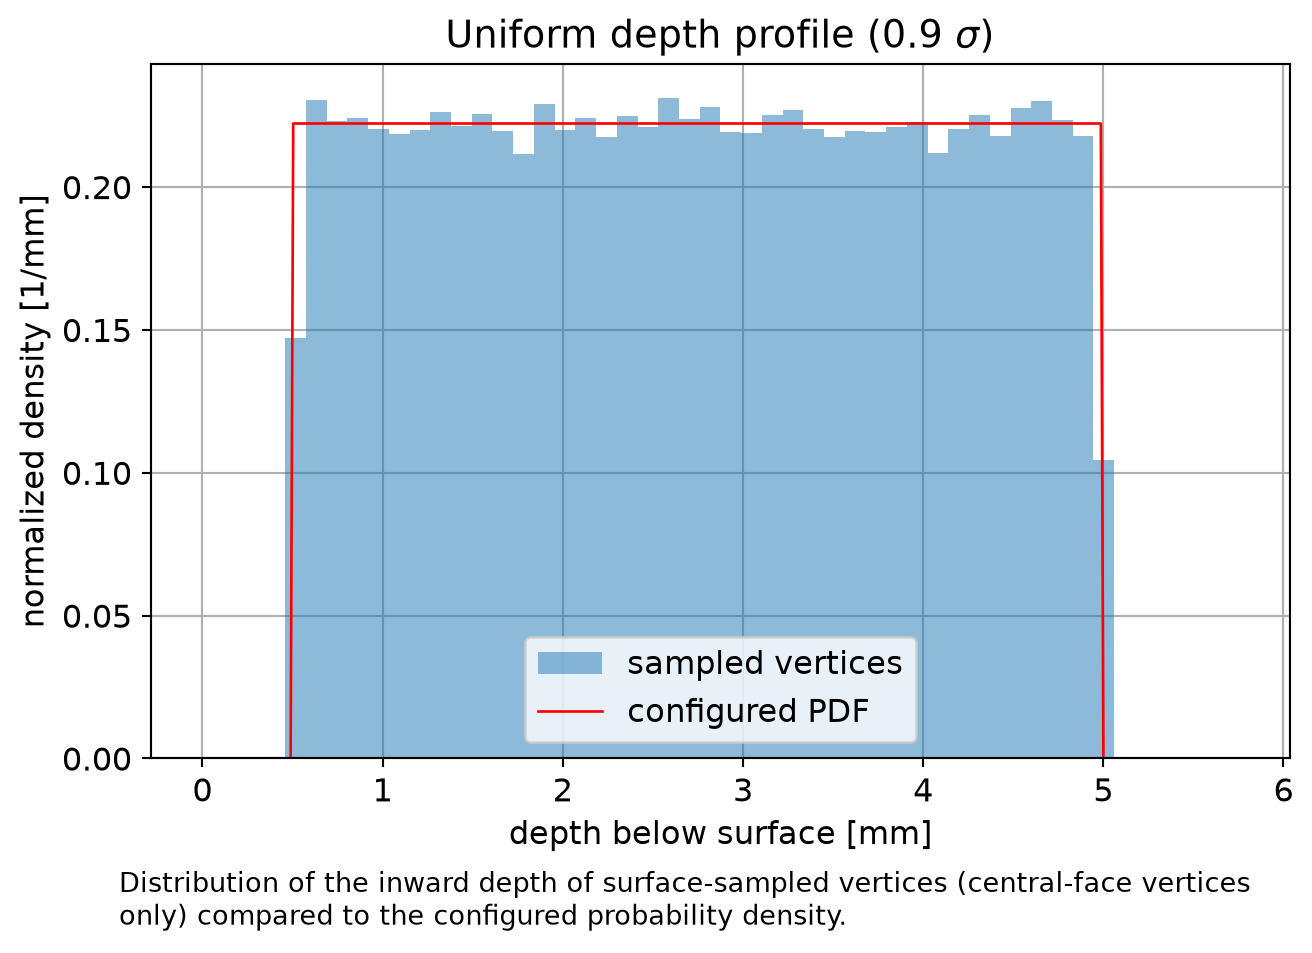
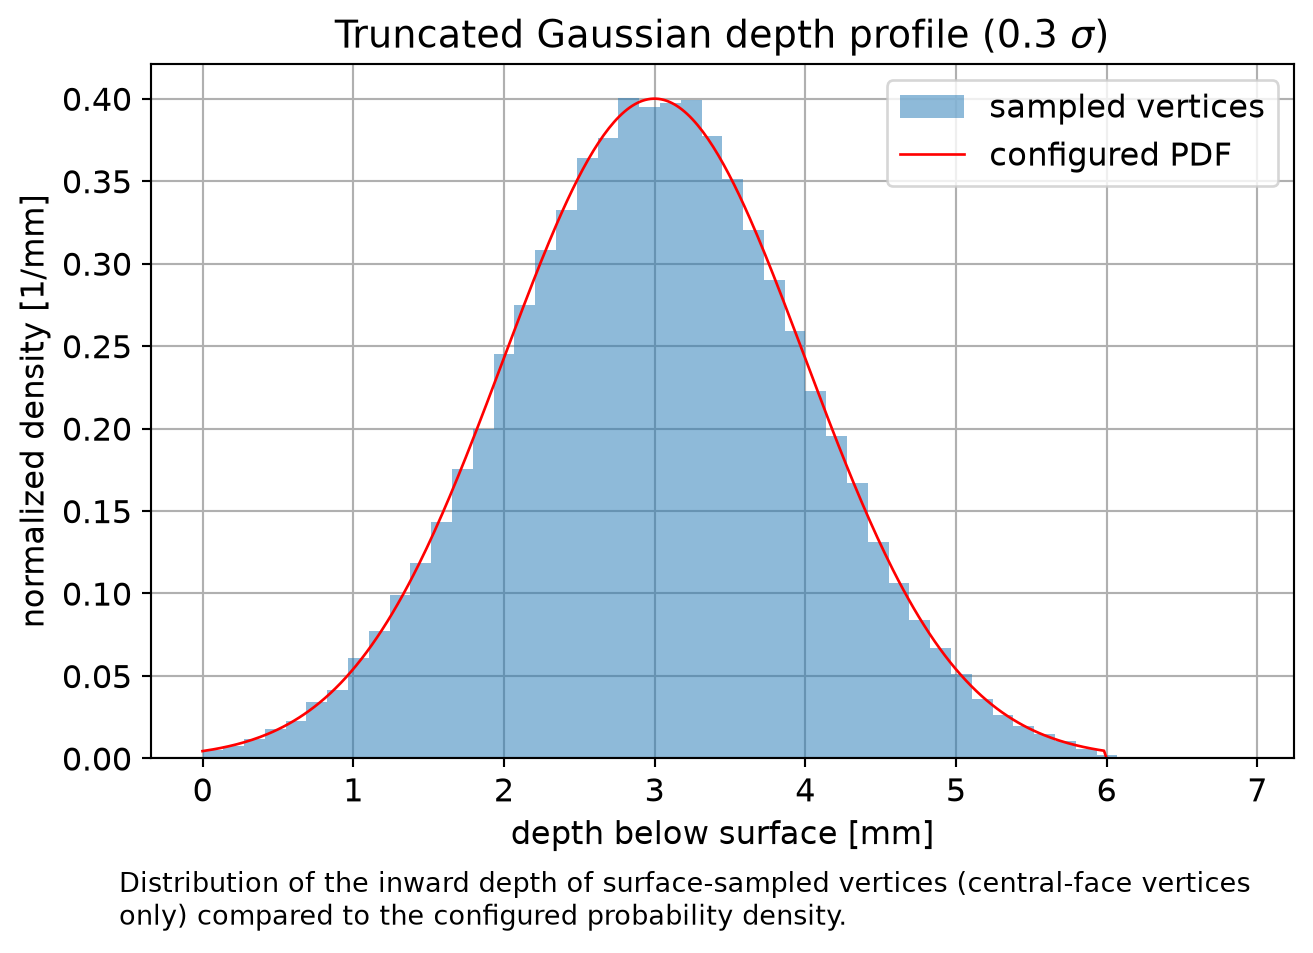
Depth distribution of surface-sampled vertices versus the configured PDF.
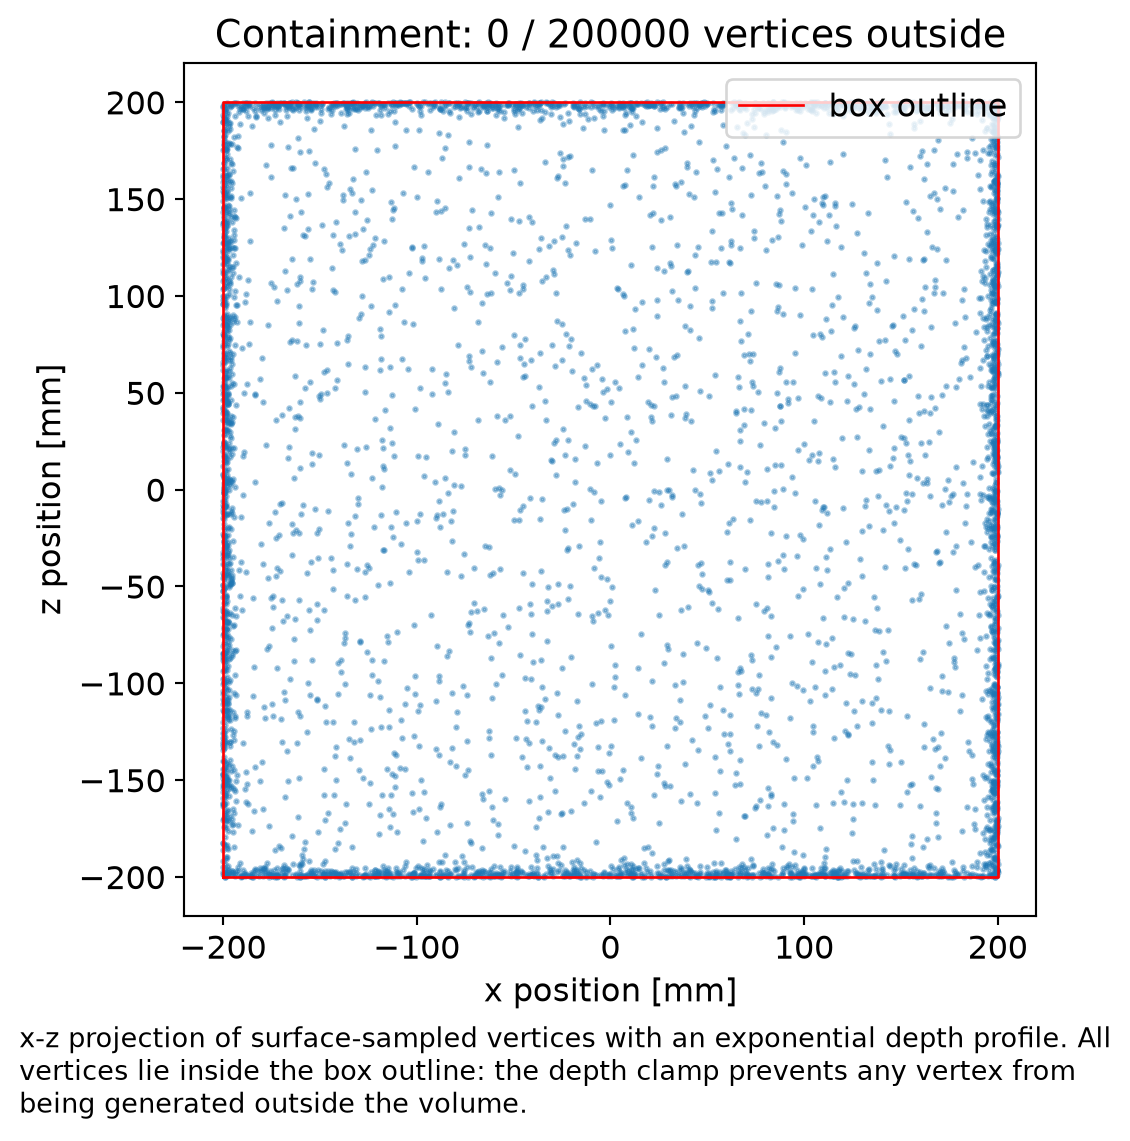
The sampled depth is clamped to the distance to the far boundary of the solid, so a displaced vertex can never cross to the other side or leave the volume. The figure below shows the projection of the generated vertices with an exponential profile: they all lie inside the box outline, and no vertex is generated outside the volume.
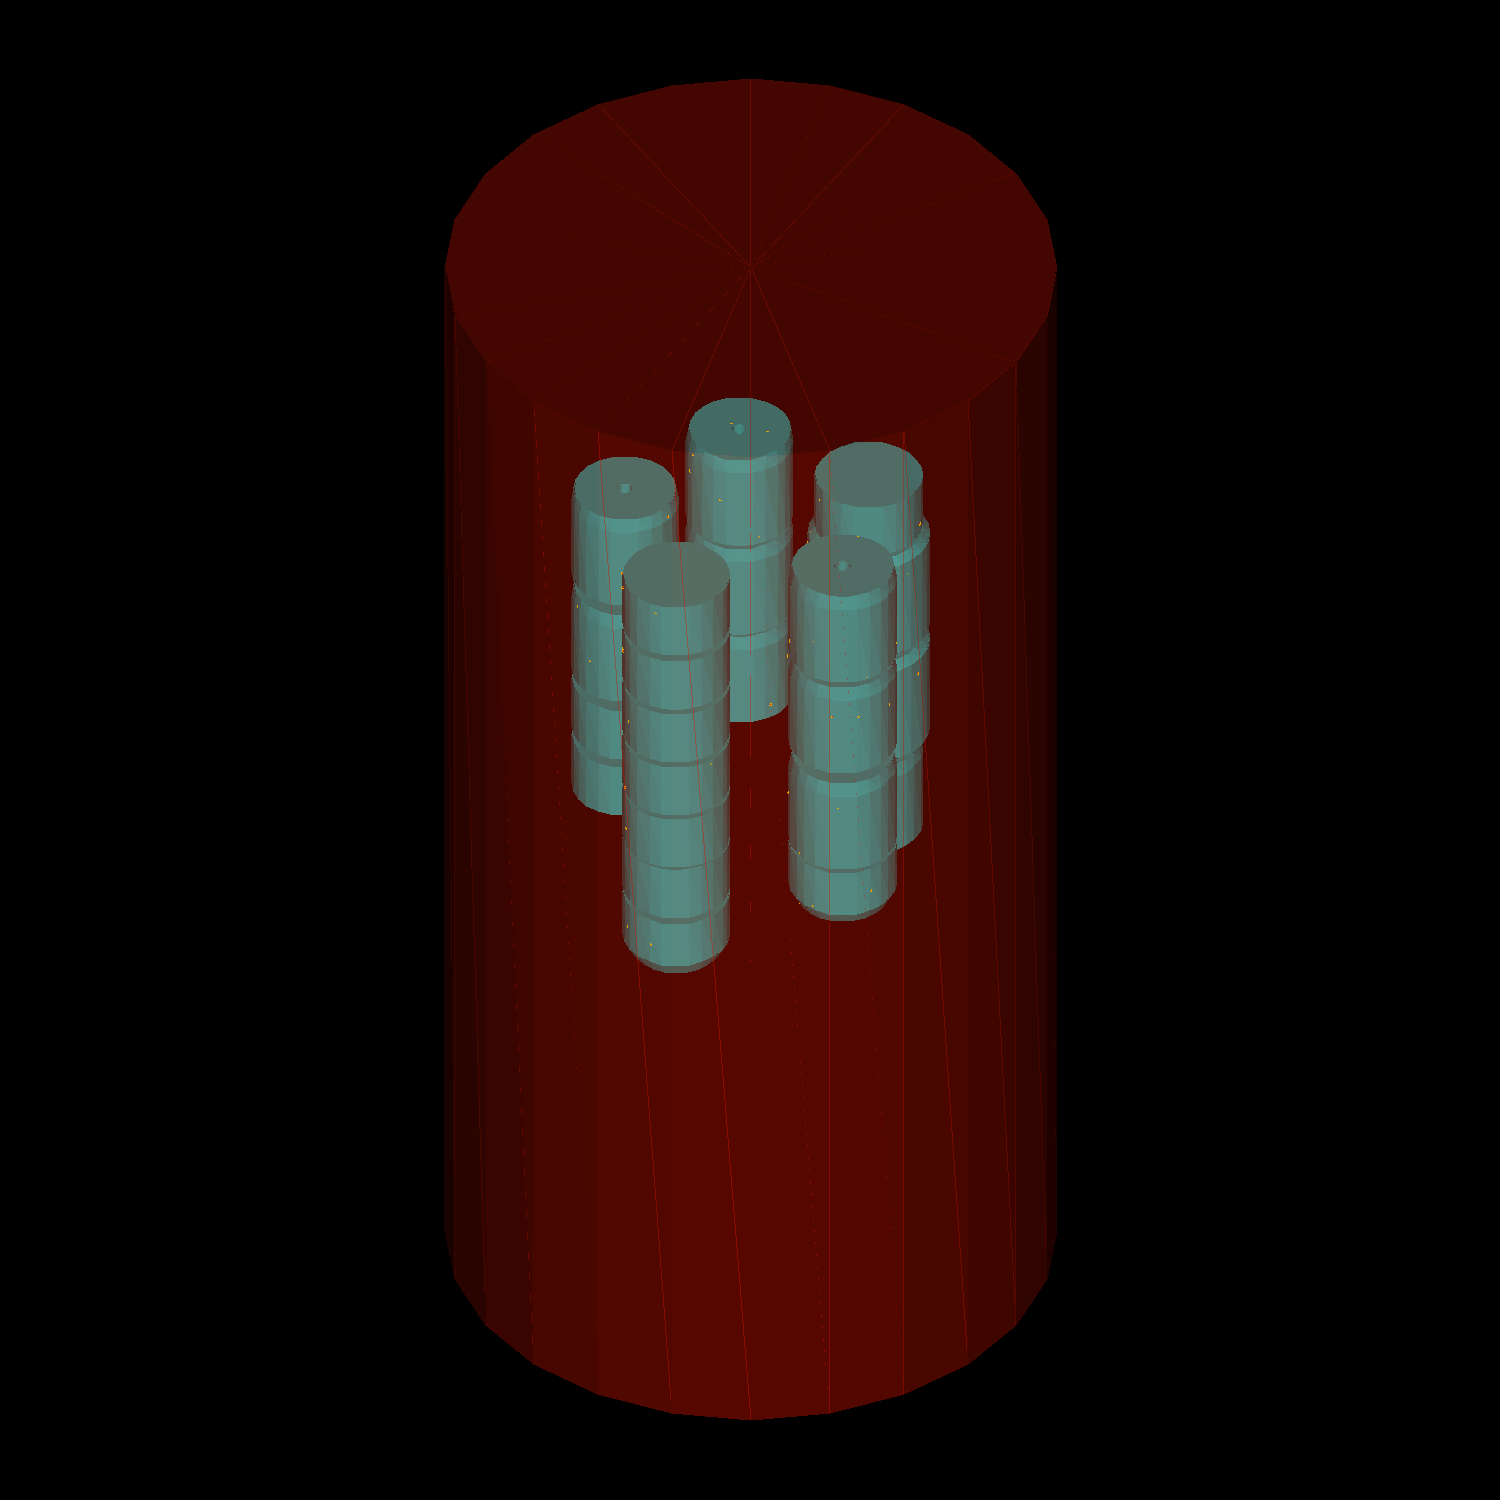
Dedicated simulations for Ge in LAr
The last sub-section of this part of the validation report contains a more specific test with an array of HPGe detectors emersed in LAr. The geometry is shown below, showing the HPGe detectors (blue) in the red LAr cylinder.
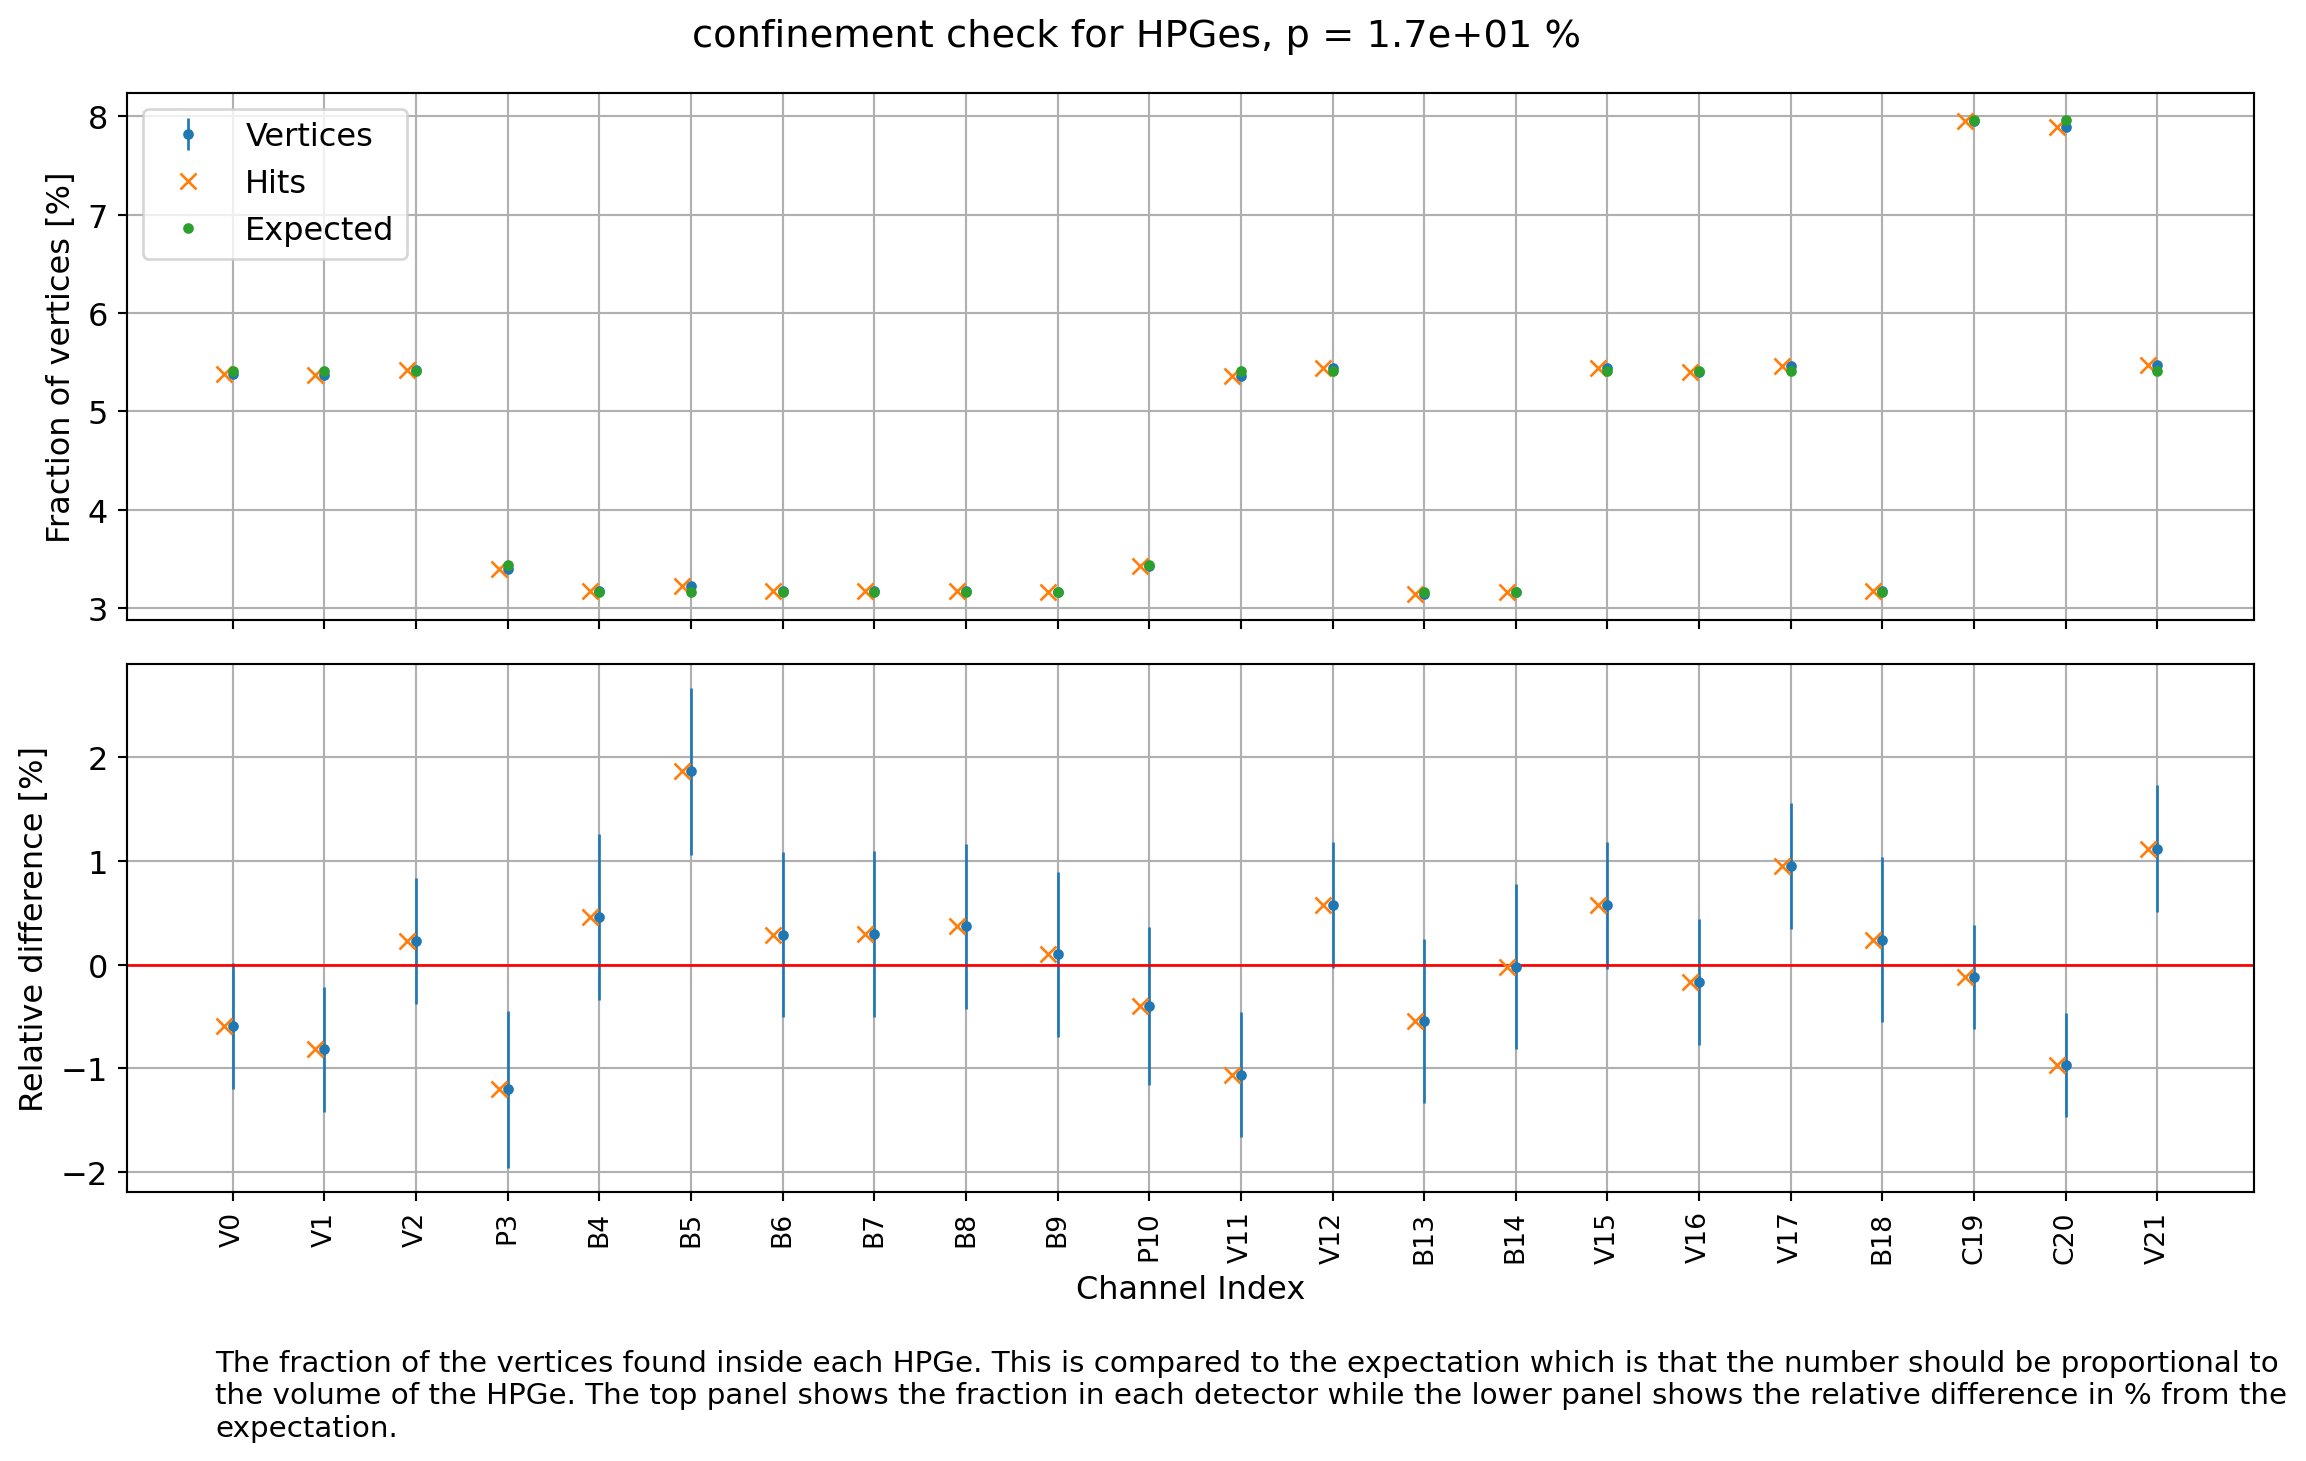
Relative fraction of events per HPGe volume
The first test consists of generating events uniformly across all the HPGe detectors and checking that the fraction of primaries in each volume matches the ratio of the volumes.
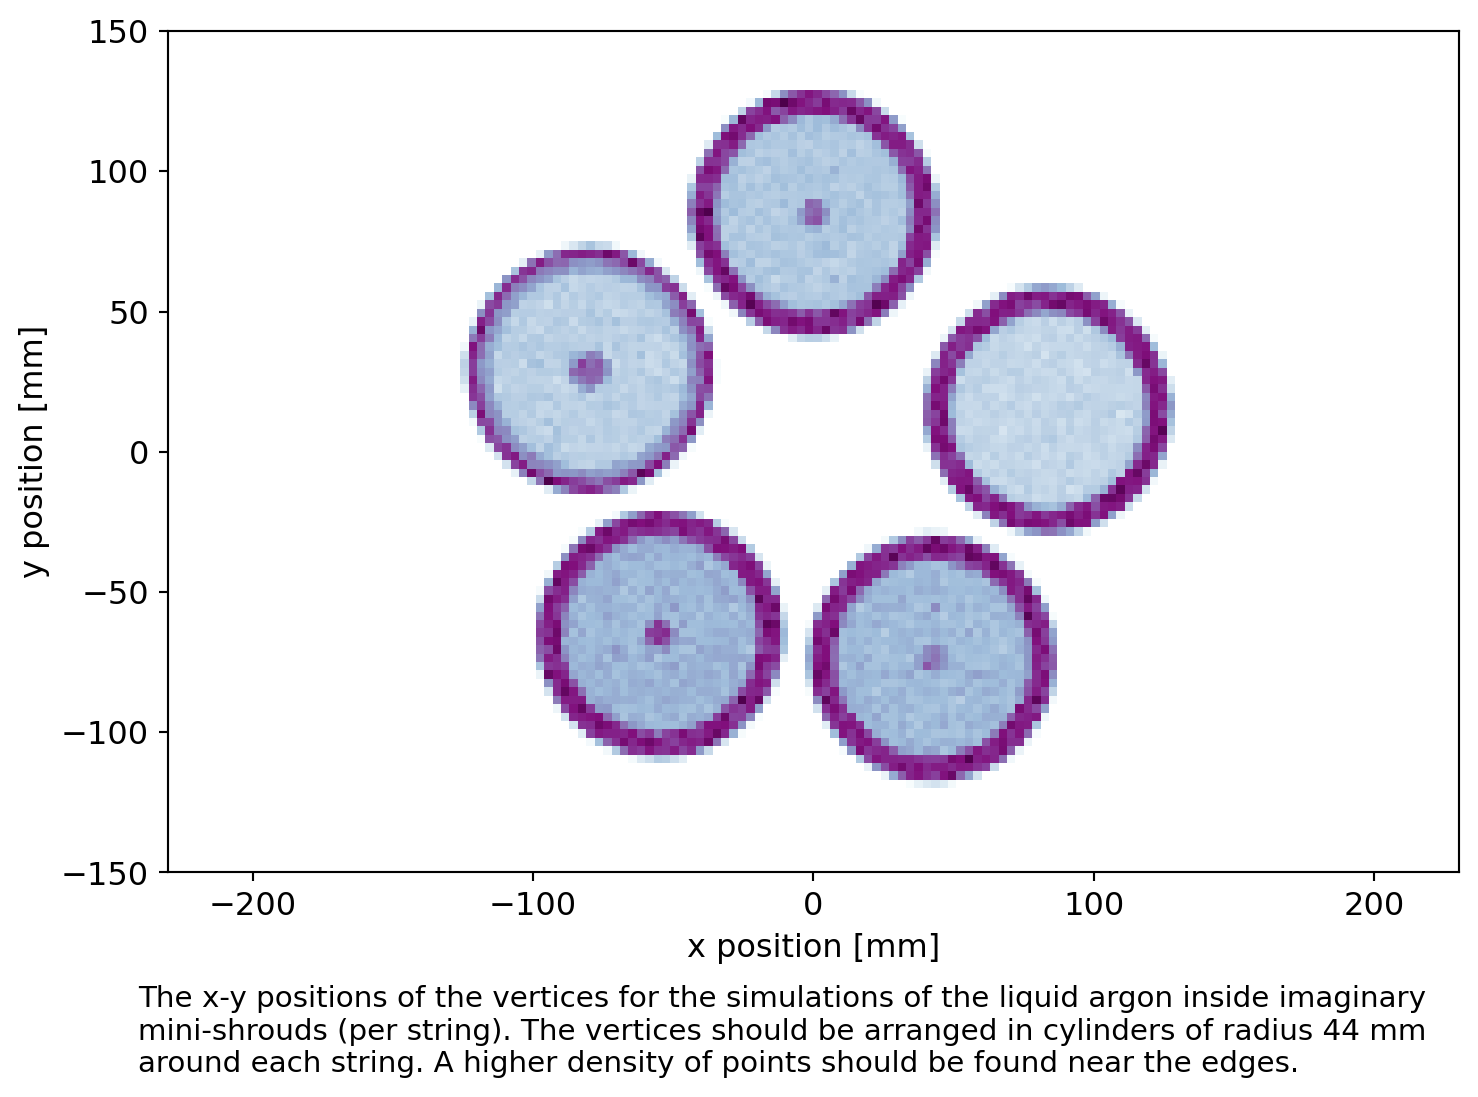
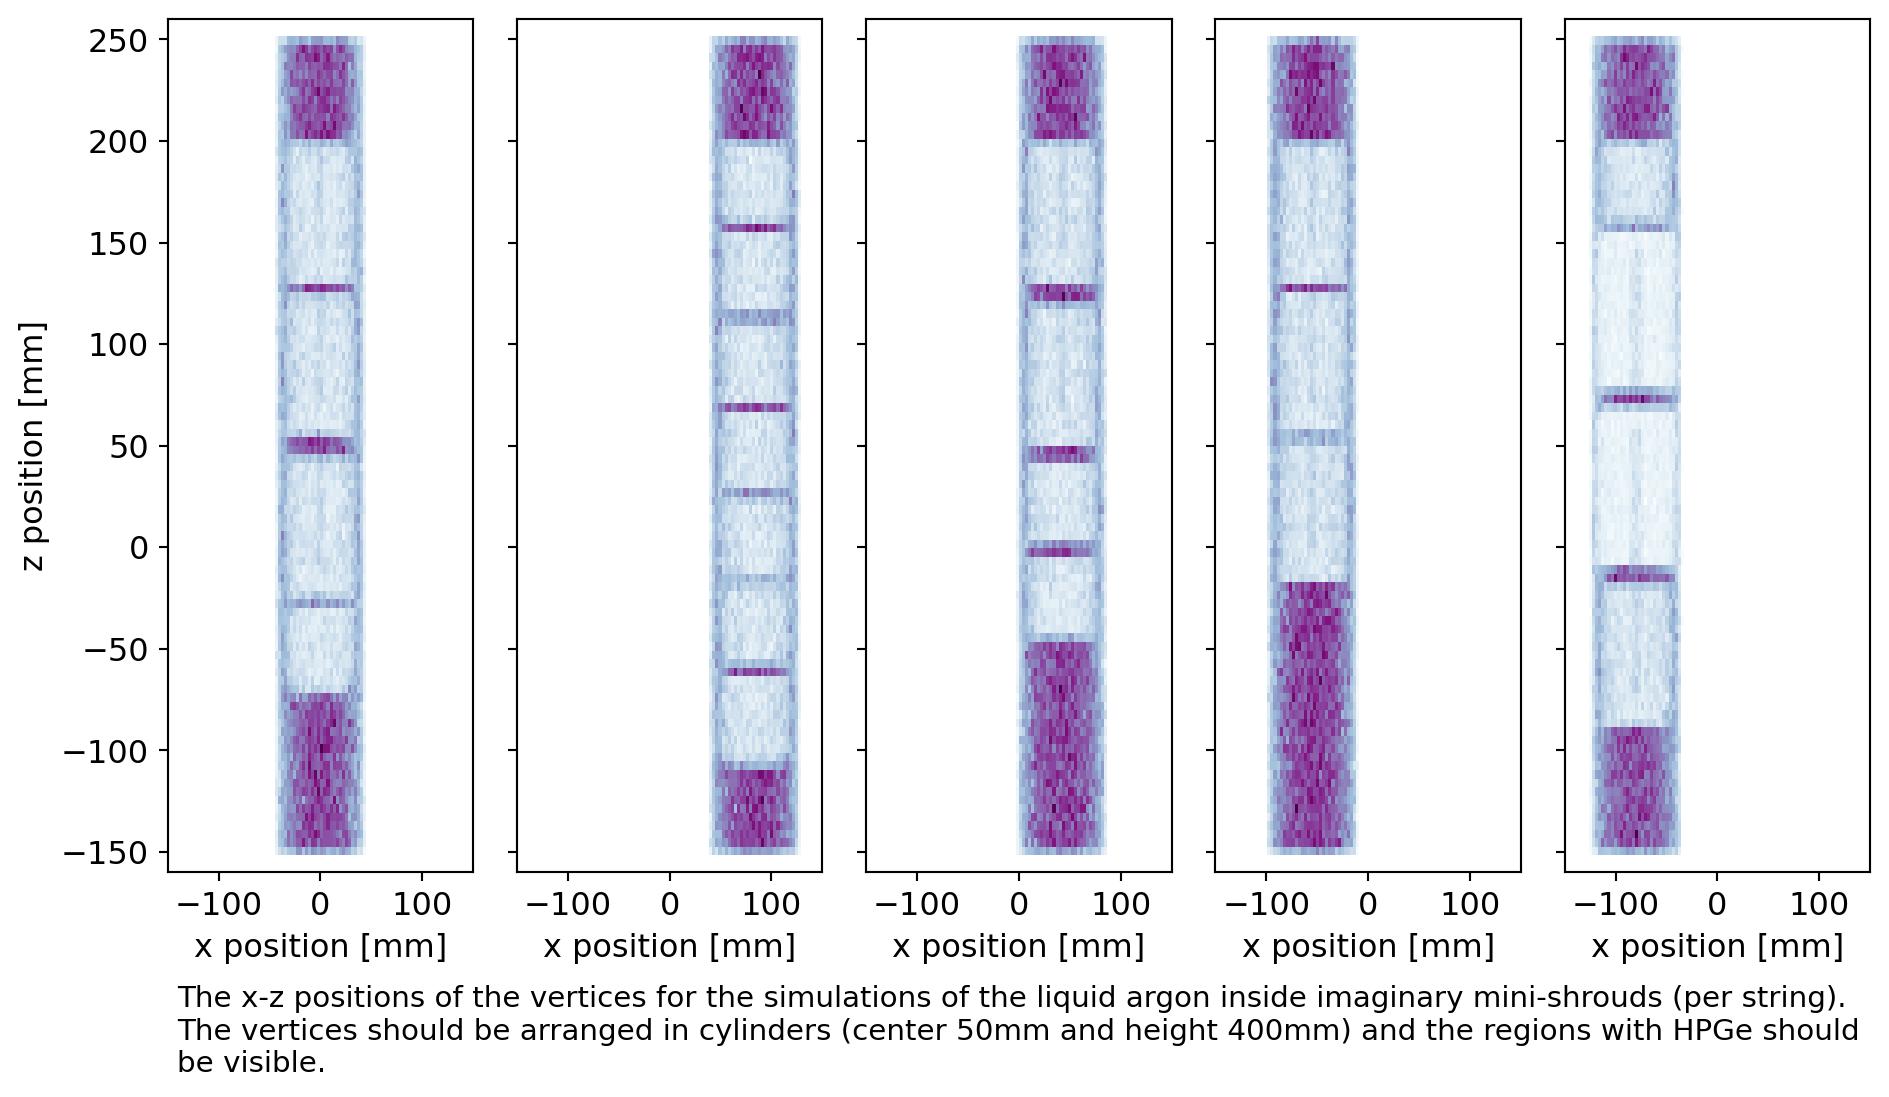
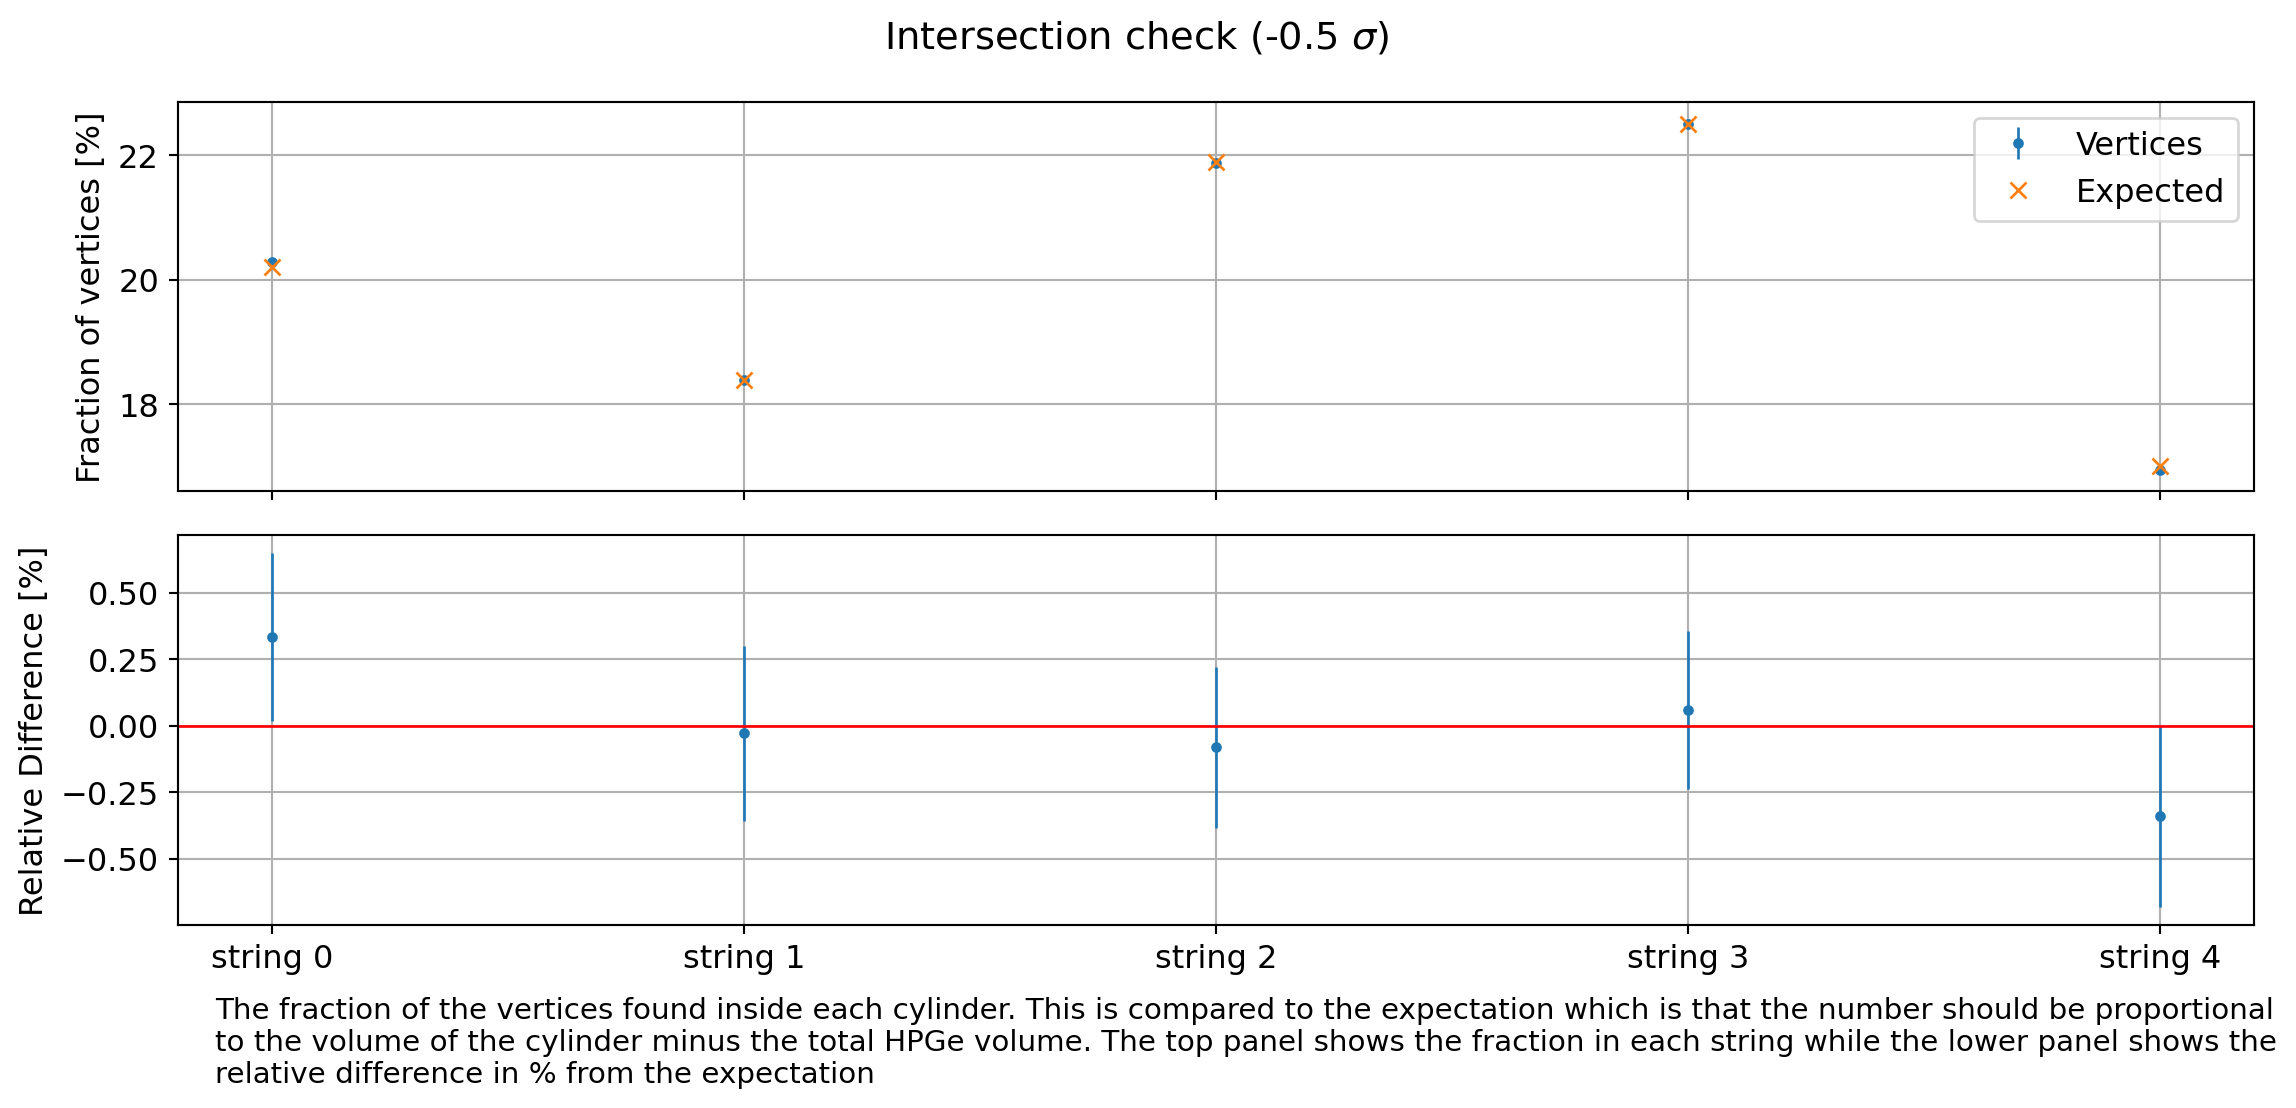
Generation in parts of the LAr volume
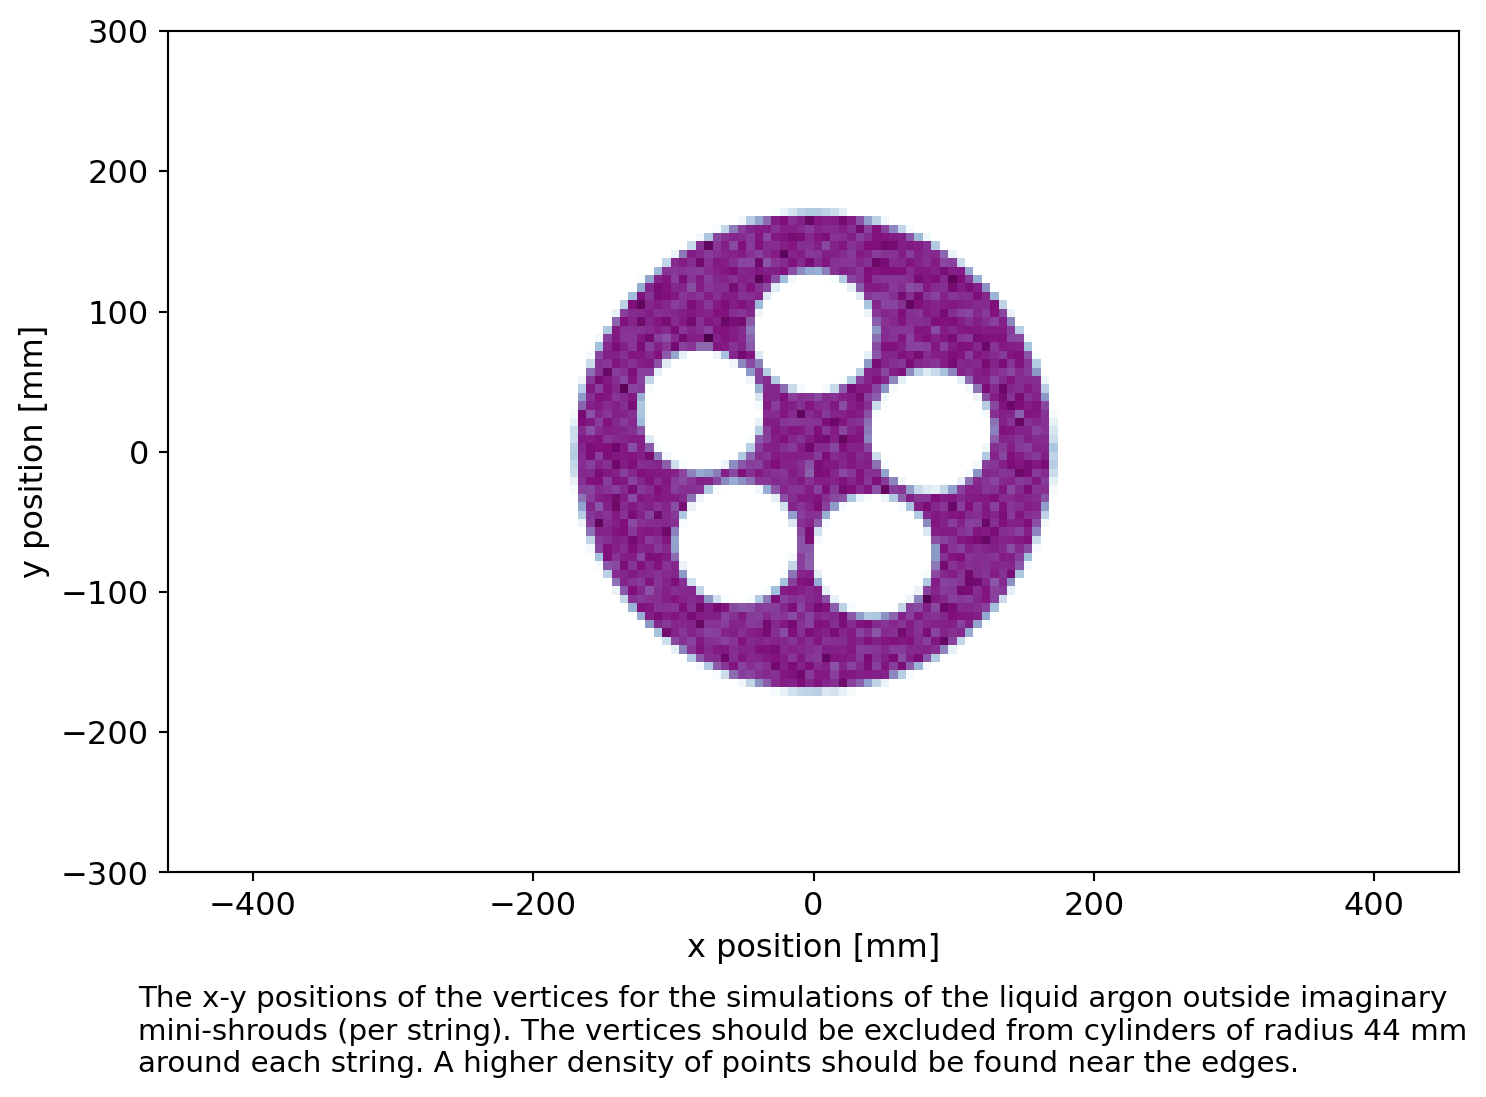
We generate events in intersection of the LAr volume surrounding the detectors and a cylinder around each detector string. We plot a histogram of the positions of the primaries which should show gaps due to the HPGe detectors. And we compute the ratio of primaries in each cylinder, which should be proportional to the volume of the cylinder minus that of the Germanium.
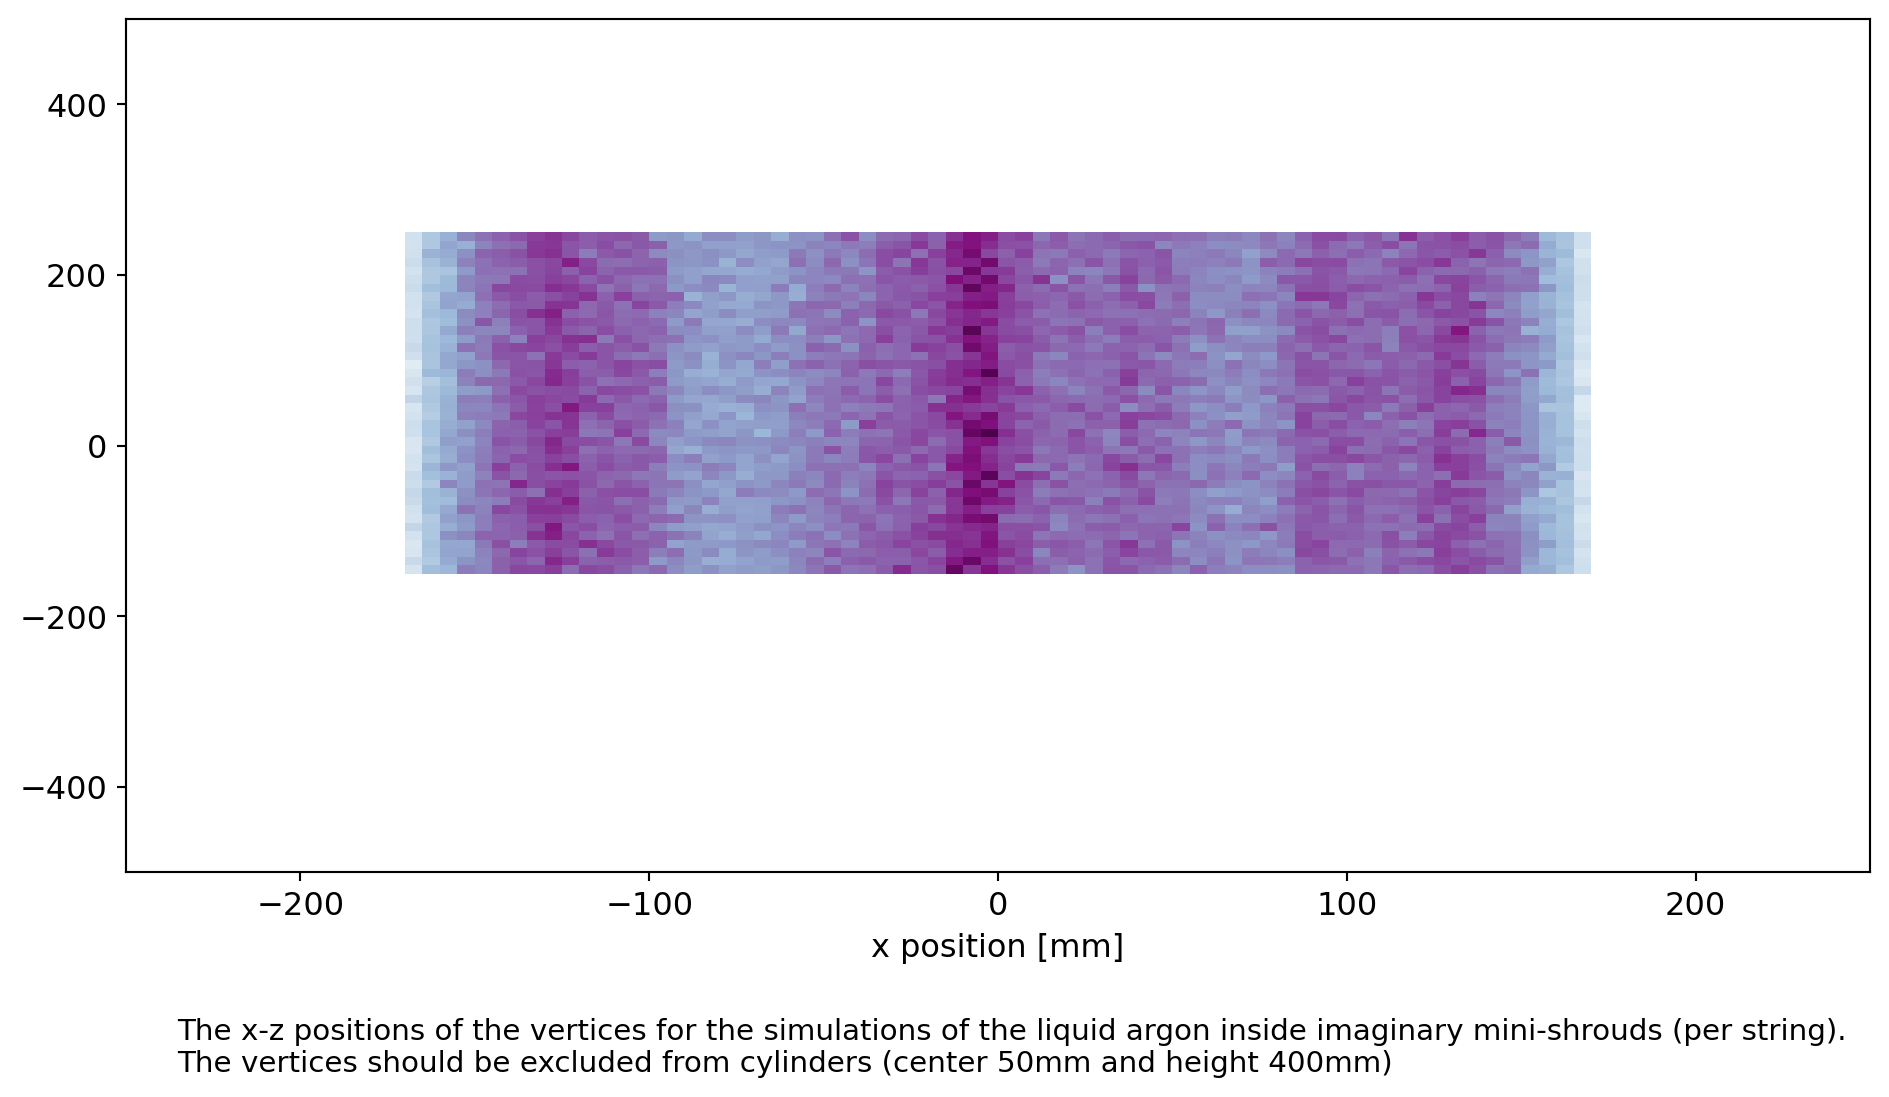
Finally, we generate primaries in the subtraction of the LAr region and the cylinders around each string.
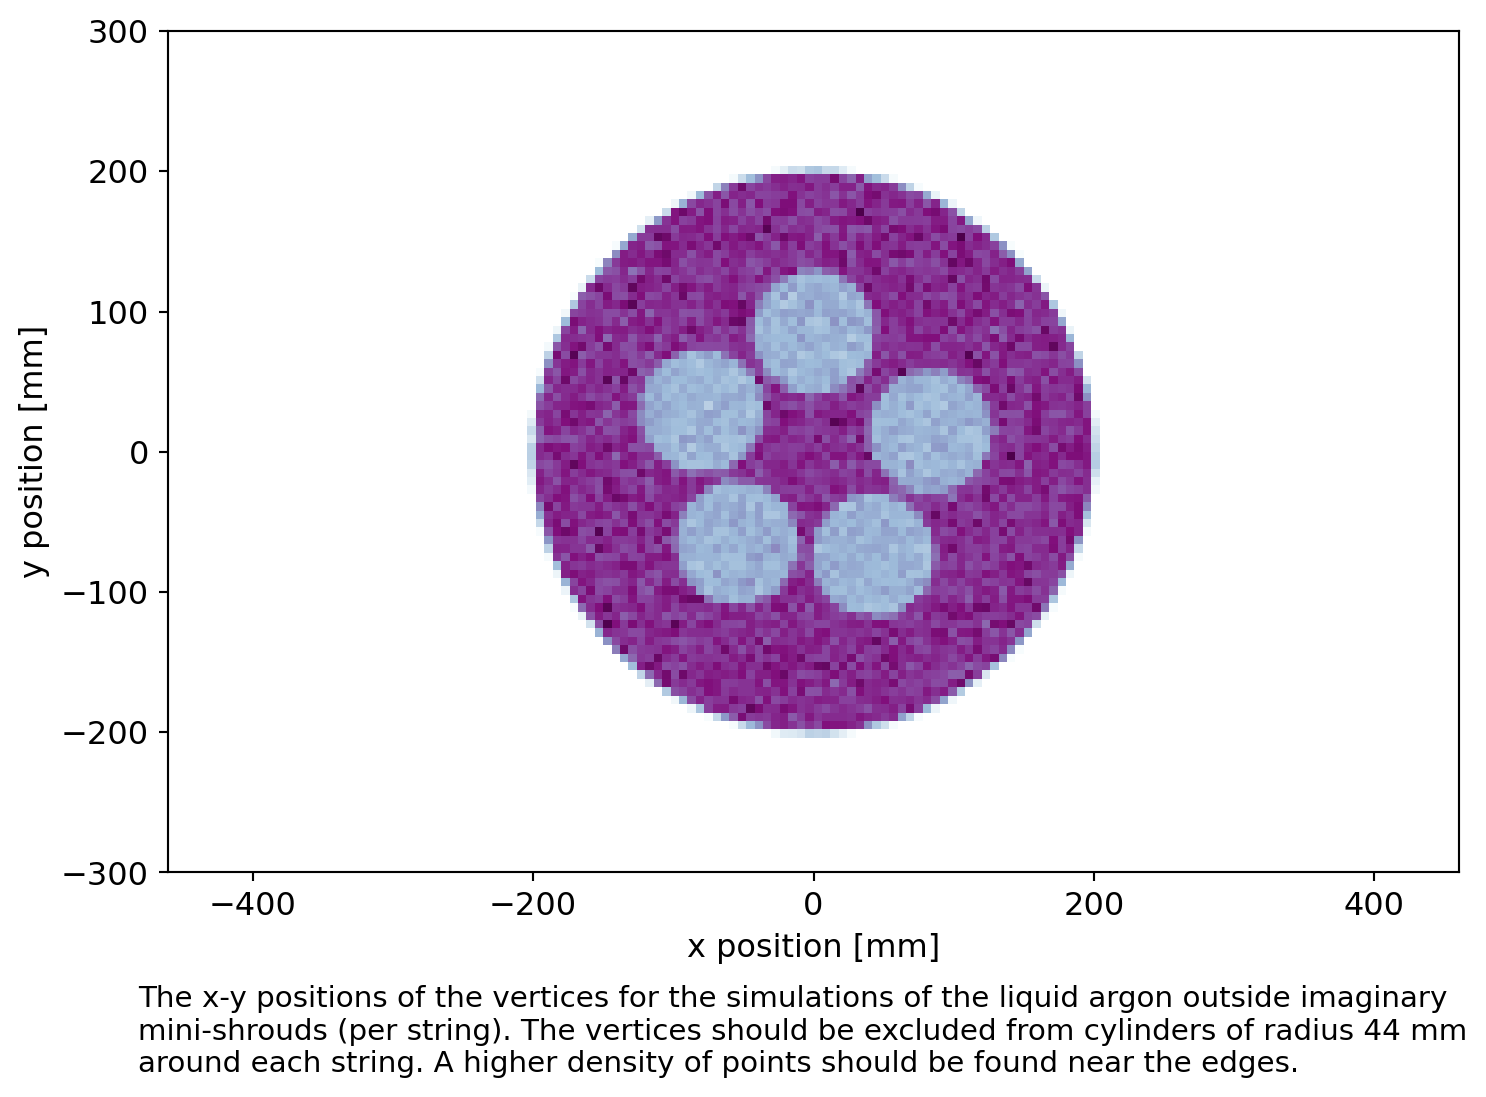
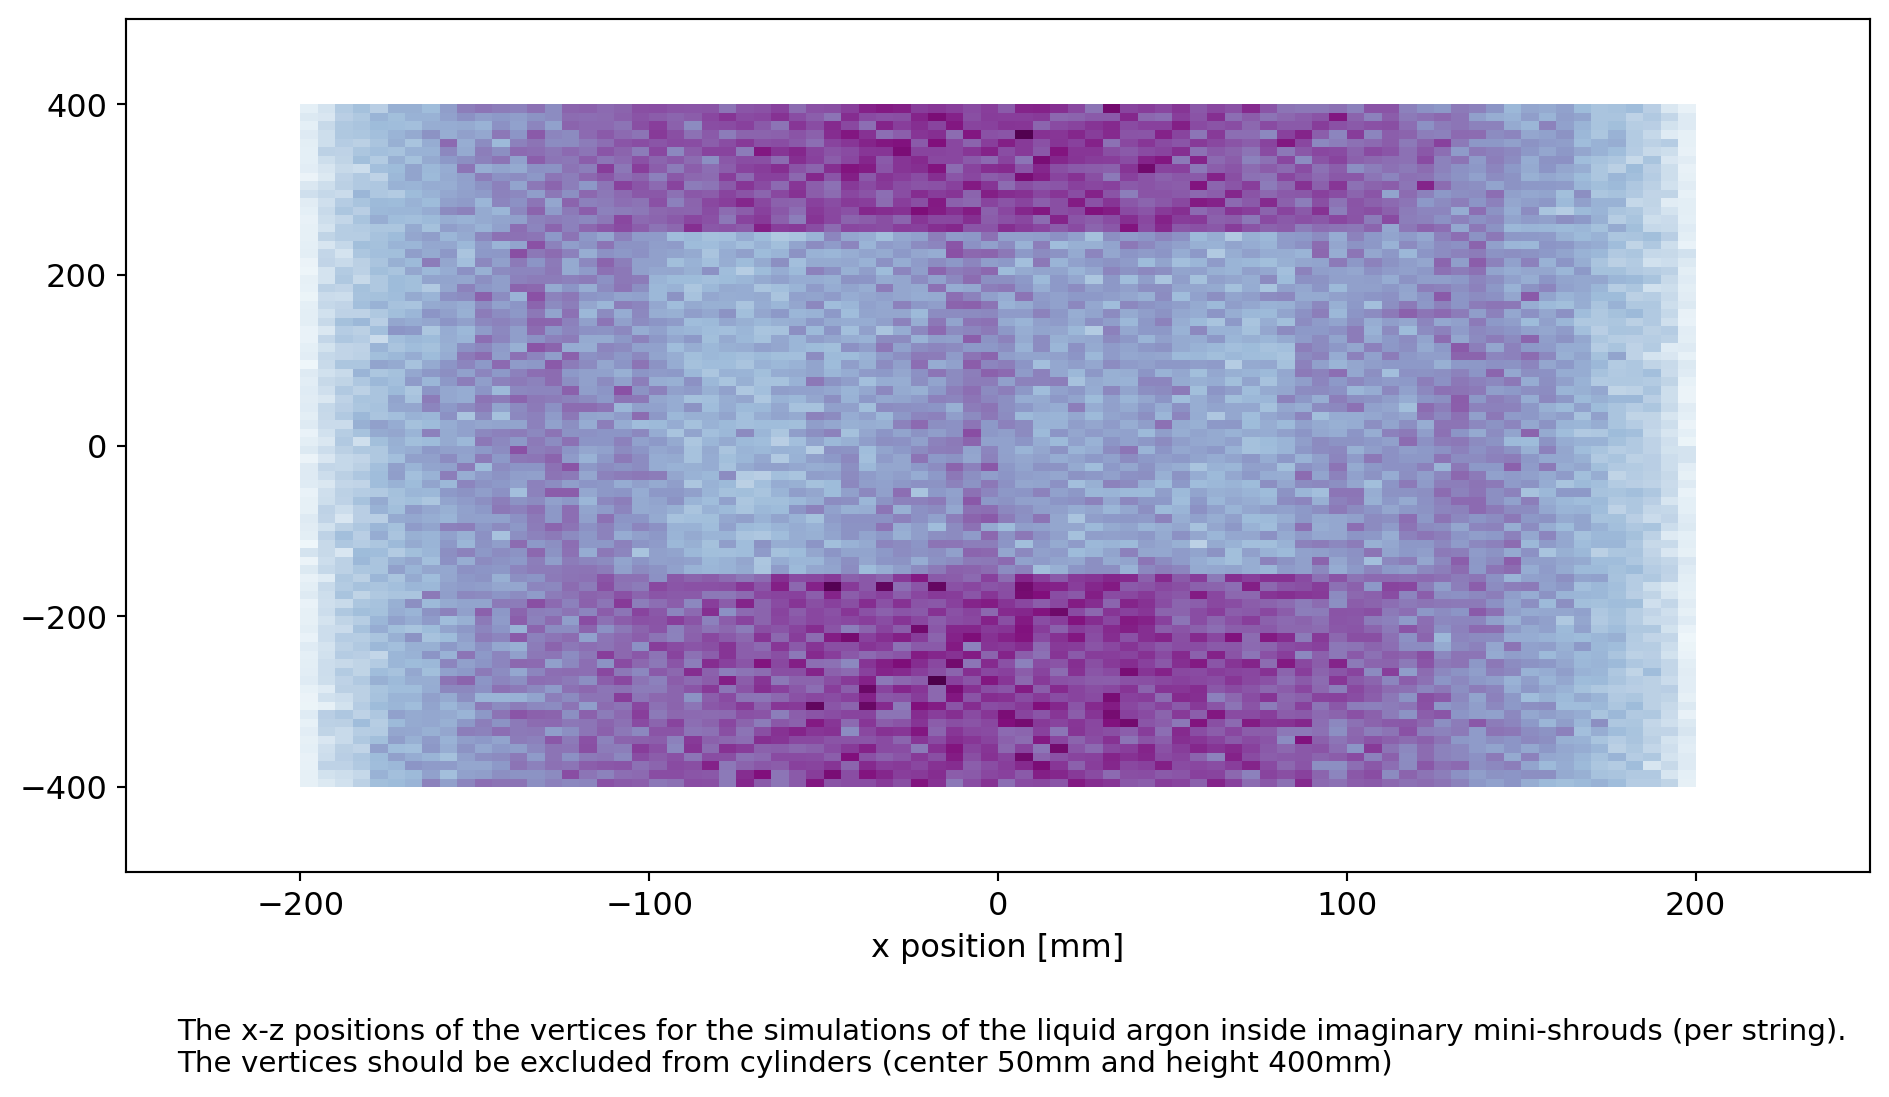
Then also with an intersection of another cylinder with the height of the strings.