Performance Benchmarks
This section tests the performance of remage for critical functions and options.
Combine low energy tracks option
This part evaluates the performance of the
/RMG/Output/.*/Cluster/CombineLowEnergyElectronTracks option. This option
combines the tracks of low energetic electrons with nearby higher energetic
tracks to reduce file size. This function was found to be problematic in
extensive simulations (like showers) if not optimized.
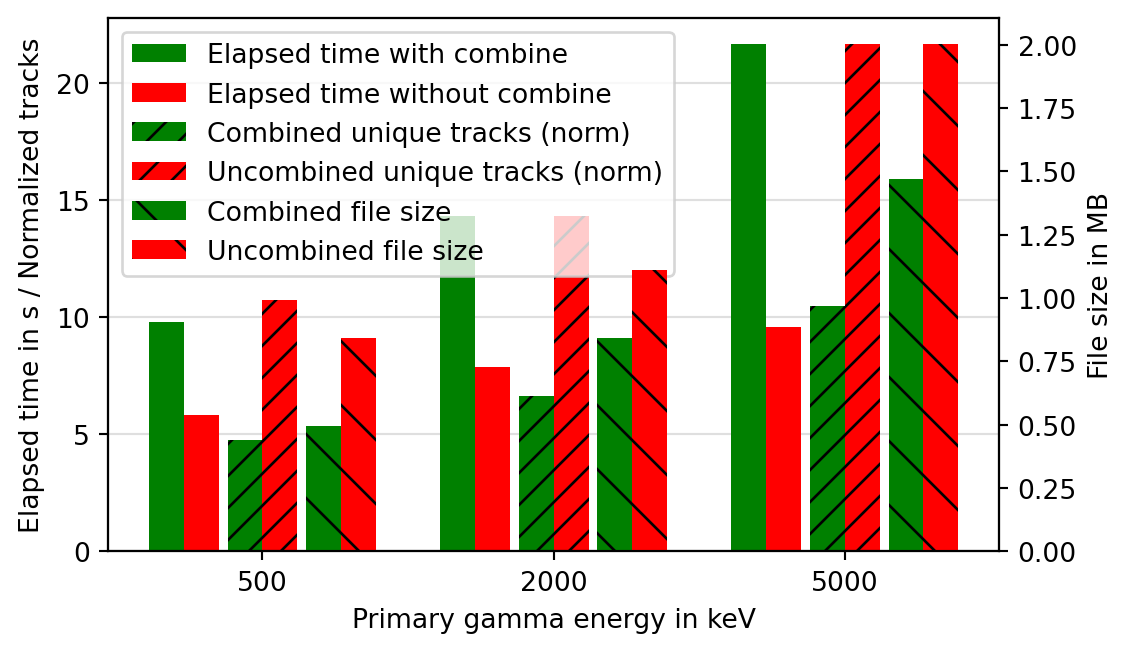
Benchmark results. For each energy 1000 gammas were simulated within one event to maximize the number of tracks to merge. The geometry is a 2x2x2m box out of liquid argon.
Staging
Staging defers selected tracks (optical photons, and optionally secondary electrons/positrons) out of the initial tracking stage; see the manual for the mechanism and commands. The benchmarks below quantify the resource savings of the different staging backends and — since staging is a performance-improving option that must not change the result — check that enabling it does not bias the physics observables.
Memory footprint
The custom staging backend (RMGDeferring) records deferred tracks into compact
fixed-size structs instead of parking full G4Tracks on the Geant4 waiting
stack, and can spill those records to a scratch file (StorePath) to limit the
resident memory further. This benchmark fires a 1 GeV muon through a
liquid-argon volume — a shower that produces large numbers of optical photons —
and measures the peak resident memory (RSS) and the processing rate for the
three backends (native Geant4 waiting stack, custom in-RAM, custom spilled to
disk), both when staging optical photons only and when additionally staging
secondary electrons/positrons.
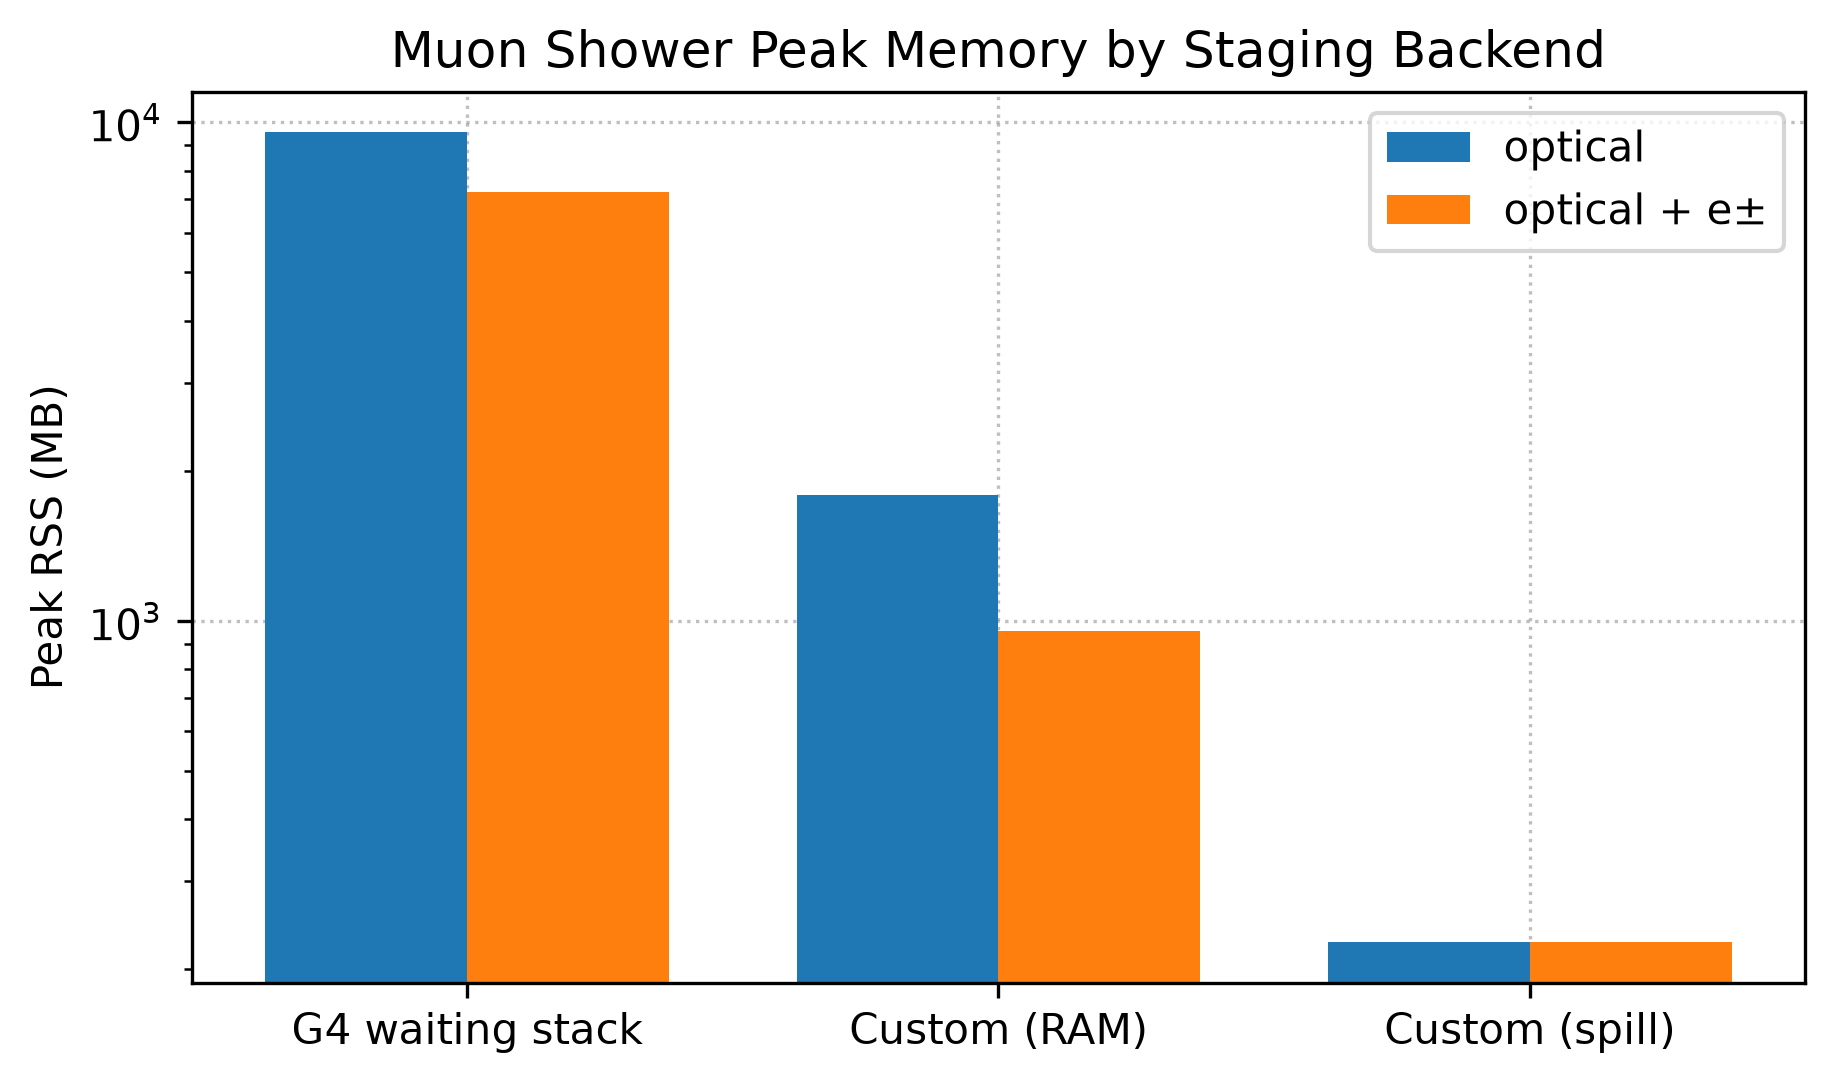
Peak resident memory of a 1 GeV muon shower in liquid argon for the three staging backends, staging optical photons only (blue) and optical photons plus secondary electrons/positrons (orange). The compact struct backend (RAM) holds far less than full G4Tracks, and spilling to disk caps it further. Note the logarithmic scale.
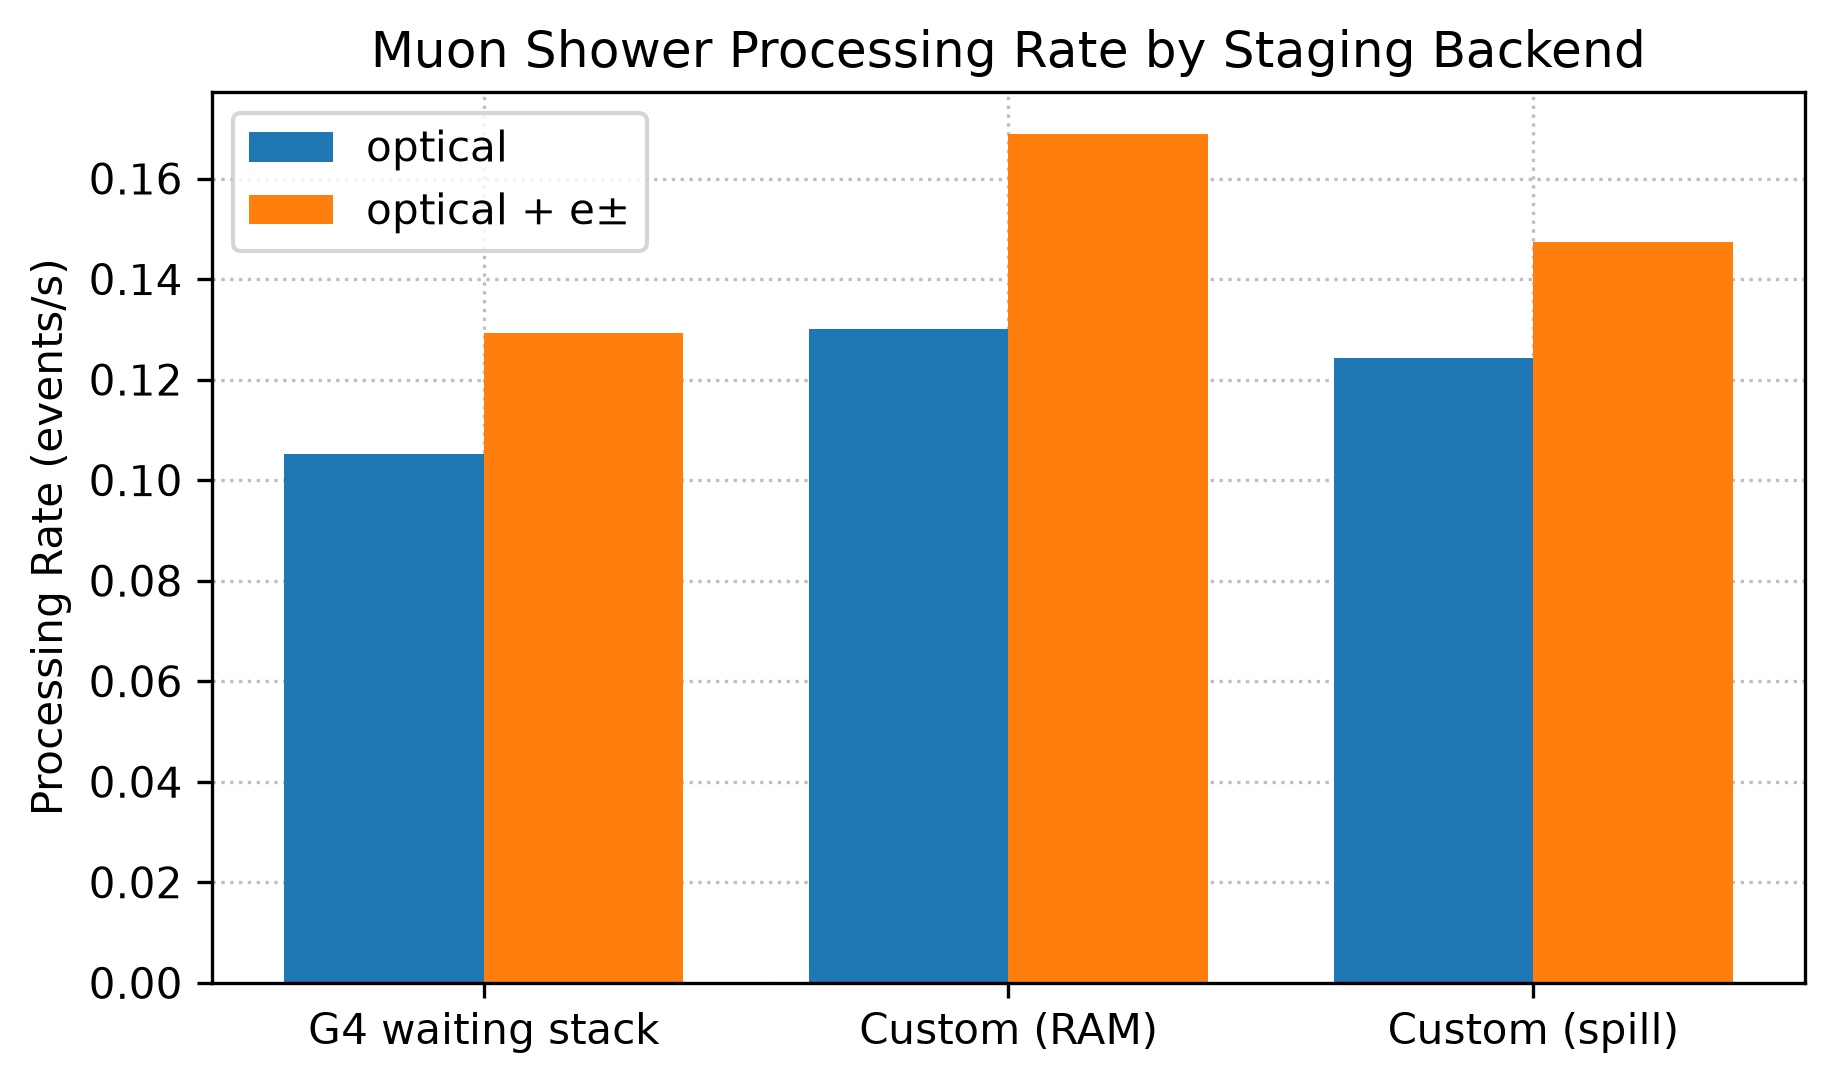
Processing rate for the same runs. The custom backend drops properties deemed unnecessary and is faster than the Geant4 backend.
Throughput vs. source distance
Electron staging defers secondary electrons and the sub-showers they would produce that are far from the detectors, which is most beneficial for far-away sources. This scan places an isotropic 2.6 MeV gamma source at several distances from a Germanium detector and compares the per-event simulation time. It compares only optical-photon staging against optical plus electron staging. The safety for electron staging is set to 20 cm, so a huge speed increase is expected between the sampled 10 cm and 30 cm distance points.
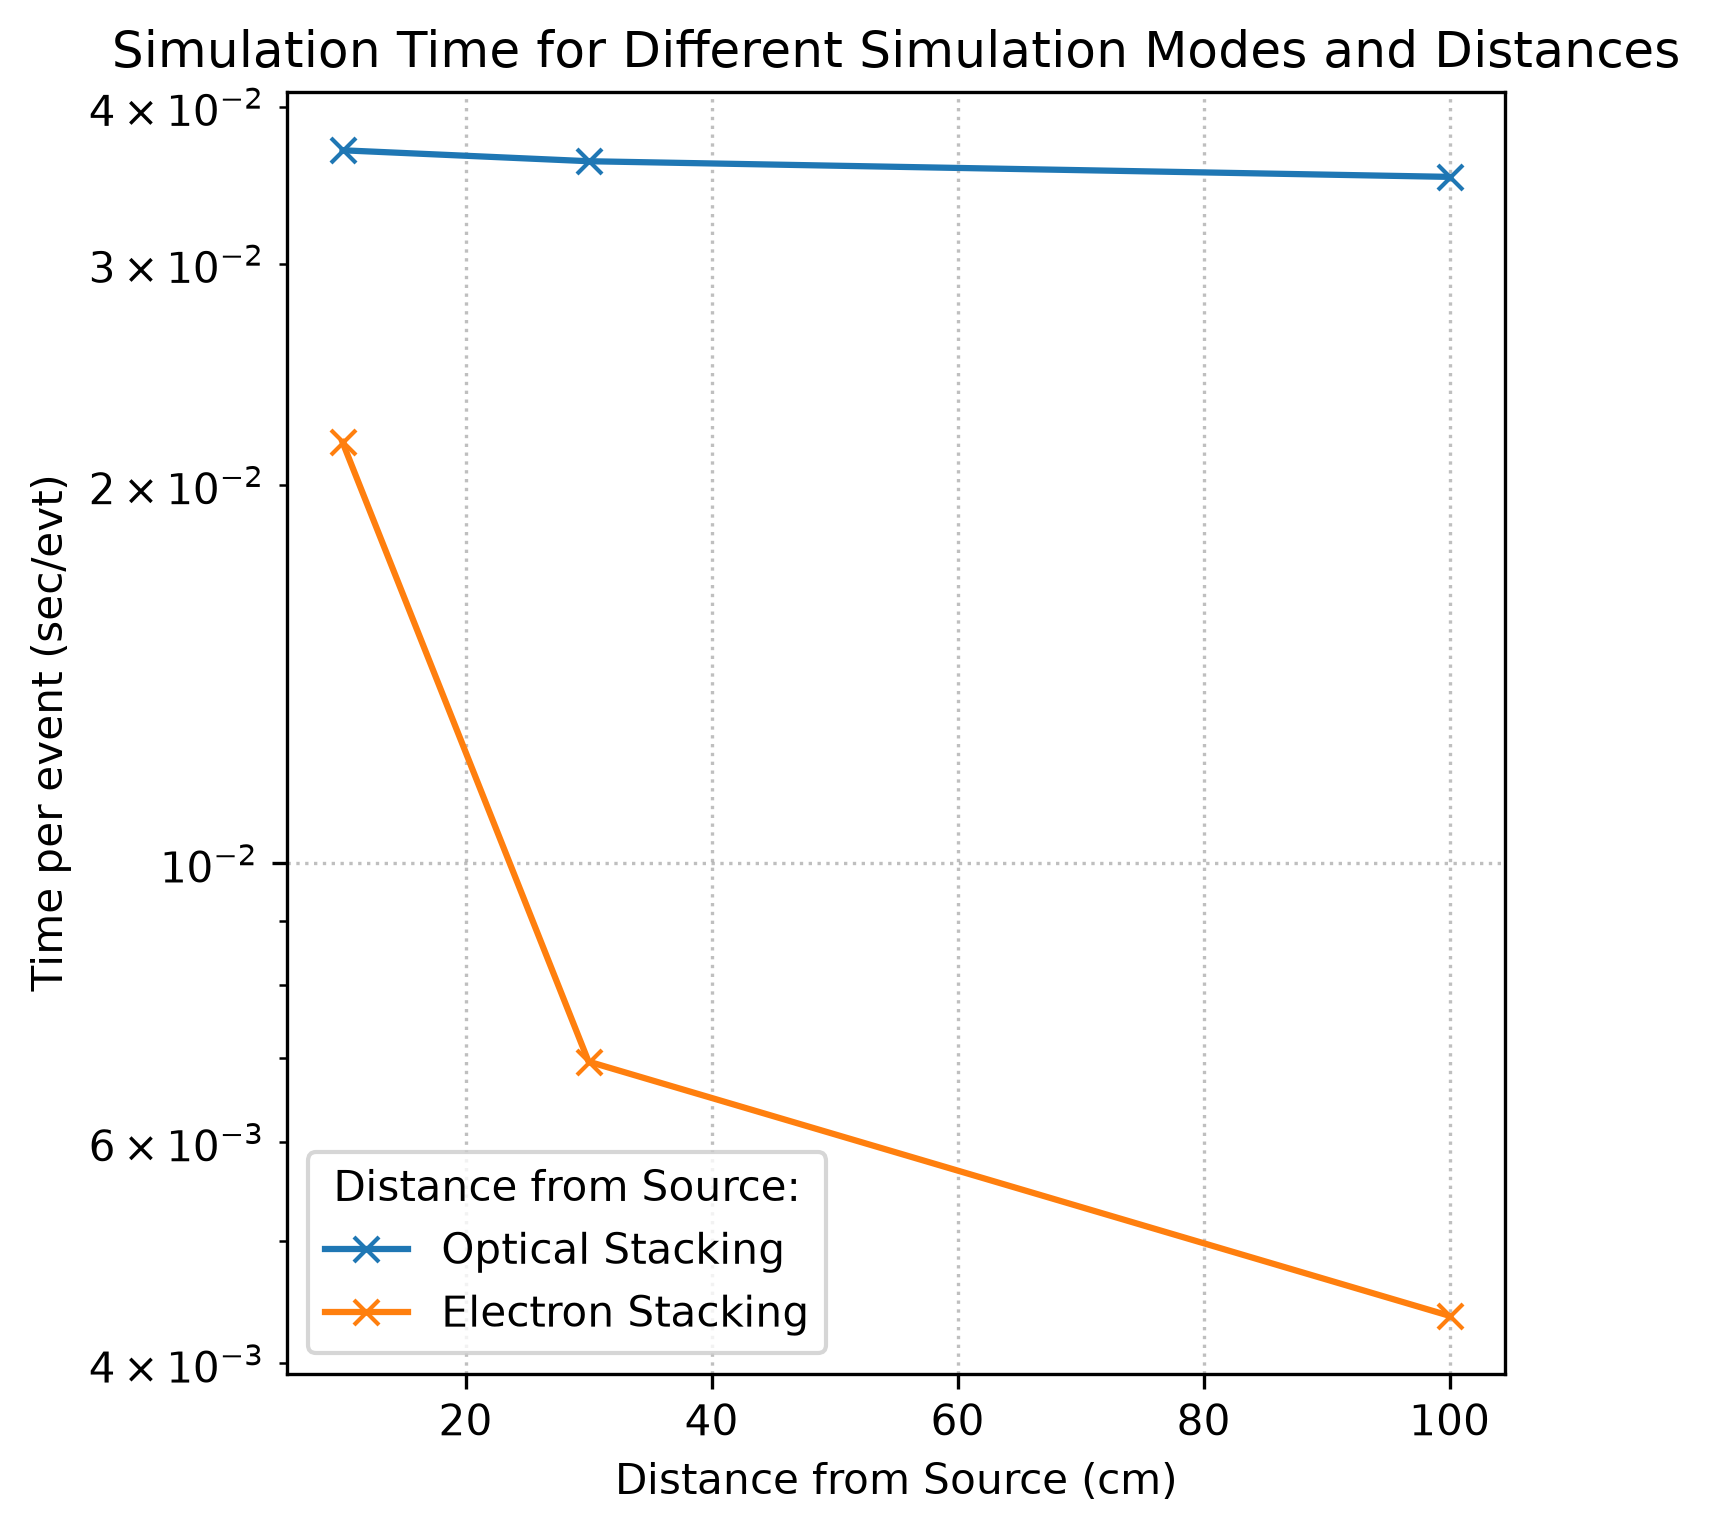
Per-event simulation time (log scale) versus source distance, for optical-photon staging alone and with electron staging added. Deferring the electrons keeps their sub-showers out of the initial stage, as long as they are at least 20cm away from the detector. So the speed-up grows with source distance.
Physics regression: Germanium energy spectrum
Deferring secondary electrons is physics-sensitive: if a staged electron would
otherwise have deposited energy in the detector, staging it out of the initial
stage could distort the recorded spectrum. This regression checks that it does
not. The isotropic 2.6 MeV gamma source is placed at different, in each plot
fixed, distances from a Germanium detector and the recorded energy spectrum with
electron staging, over a range of VolumeSafety values (3.1, 10, 31 cm), is
compared against the no stacking baseline. The lower panel of each figure shows
the residuals normalised to the baseline statistical uncertainty; the spectra
should agree within Poisson fluctuations (Preferably within 3 sigma).
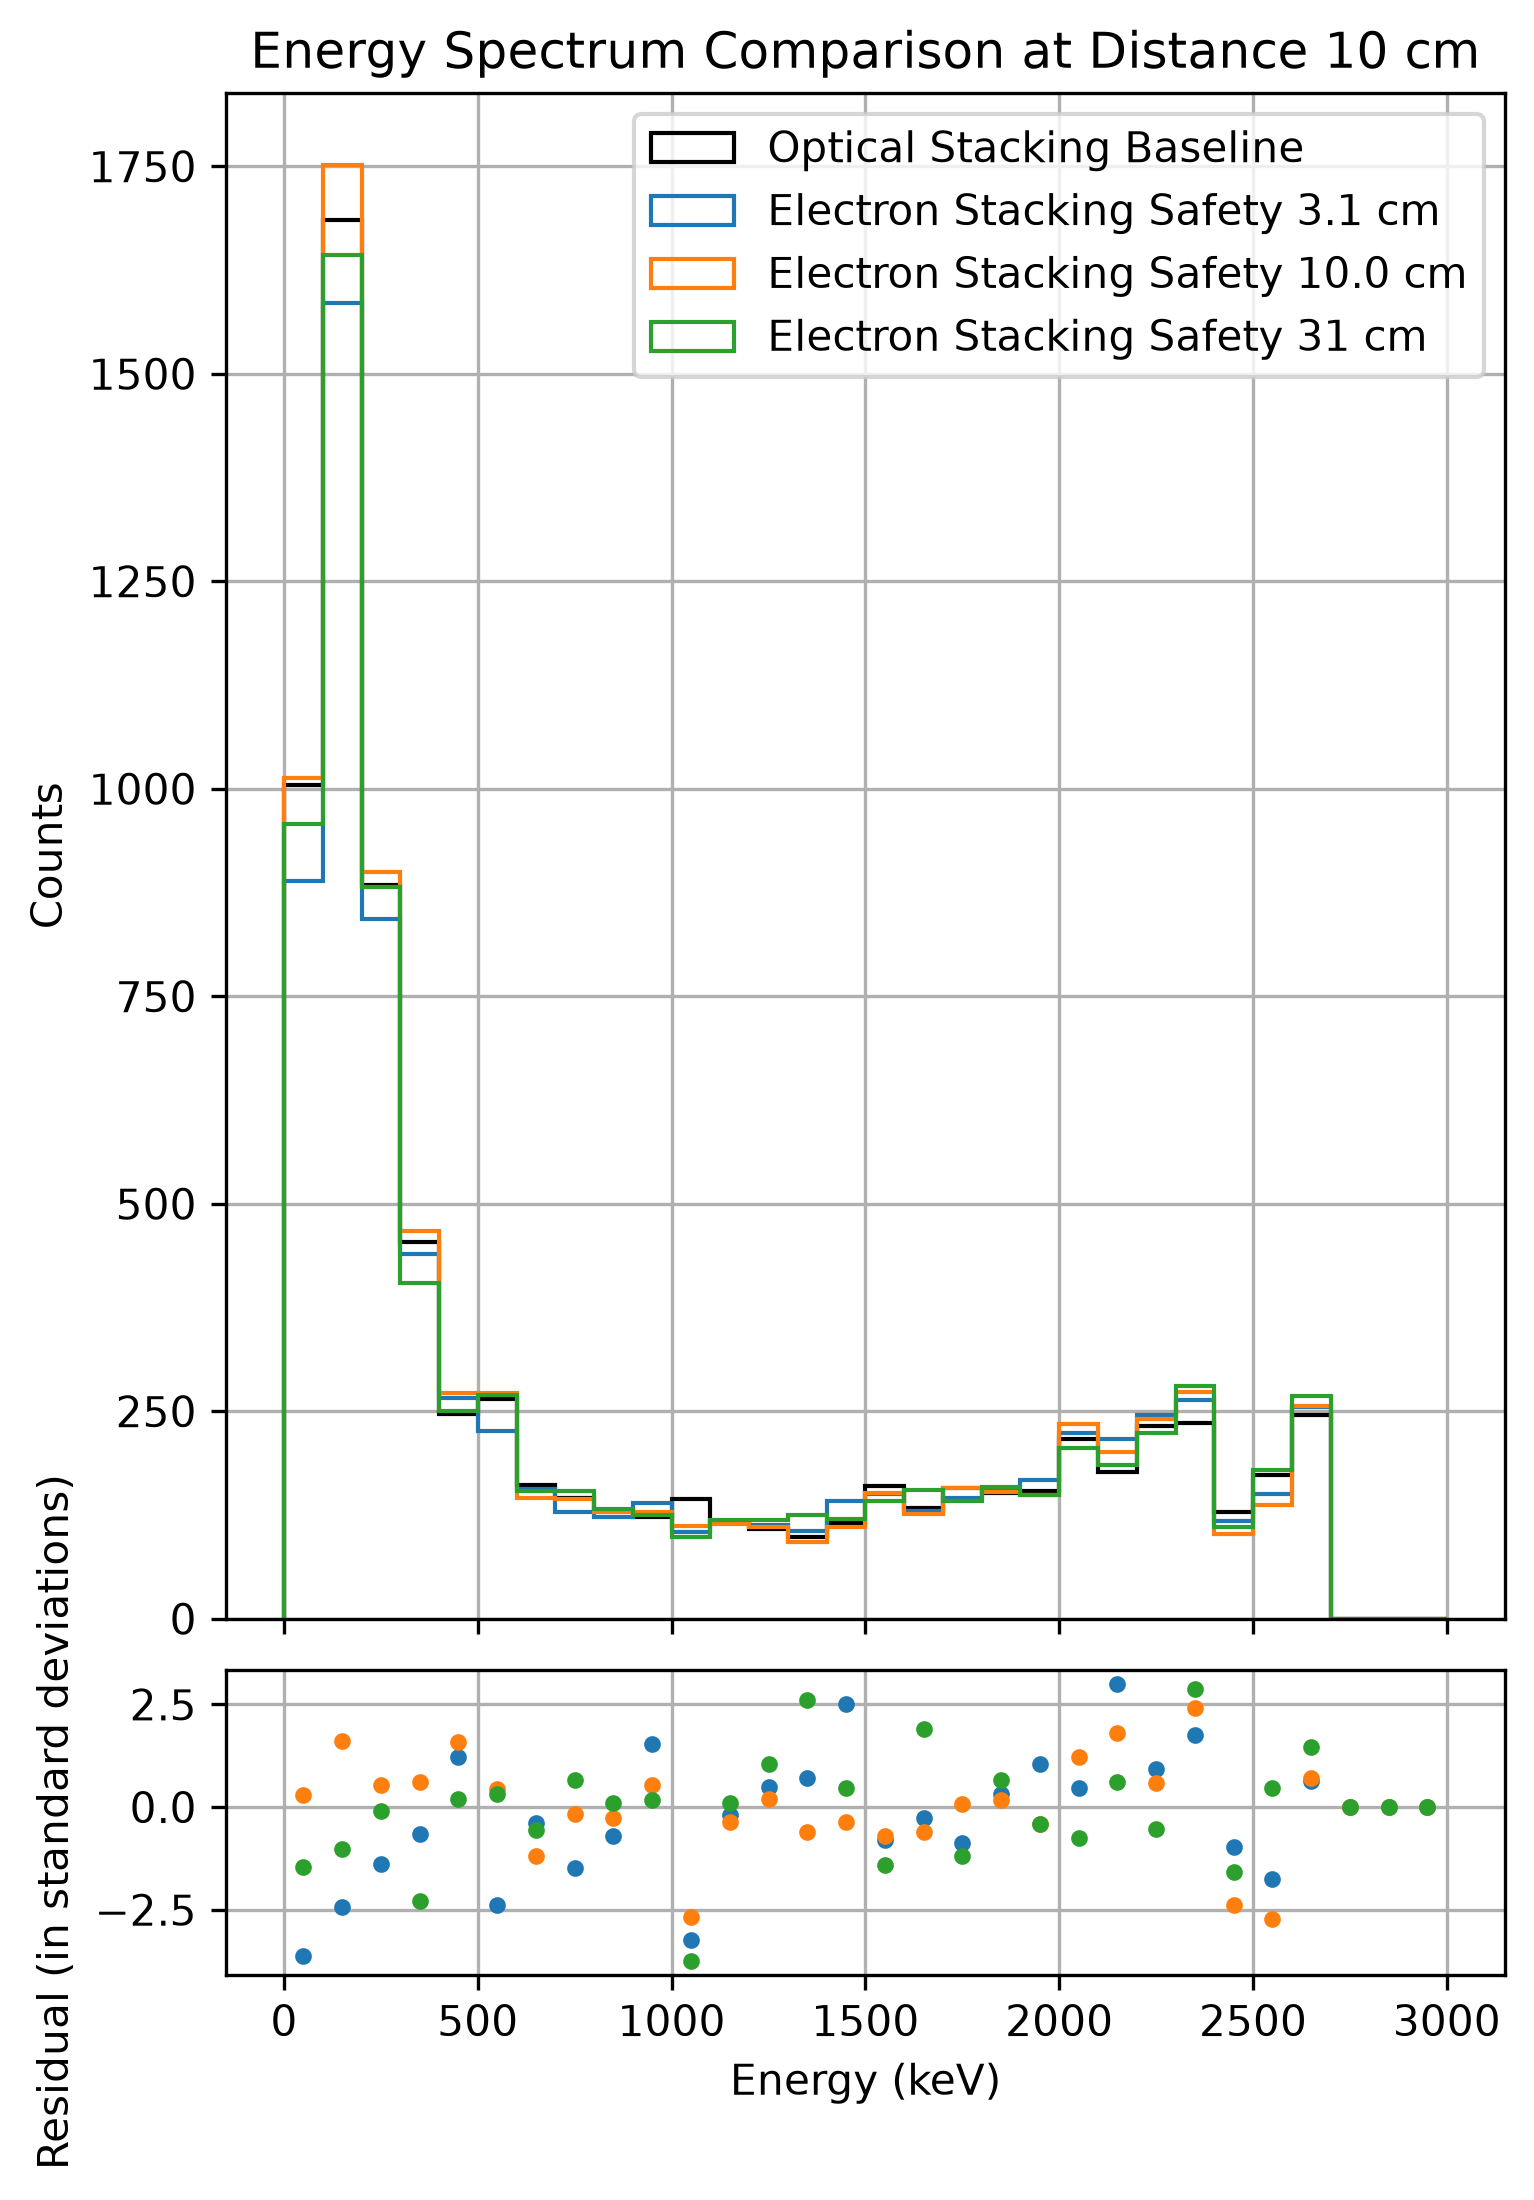
Germanium energy spectrum with electron staging versus the no stacking baseline. Comparison of 3 safety distances. Higher safety should always be more accurate. Source 10 cm from the detector, with normalised residuals below.
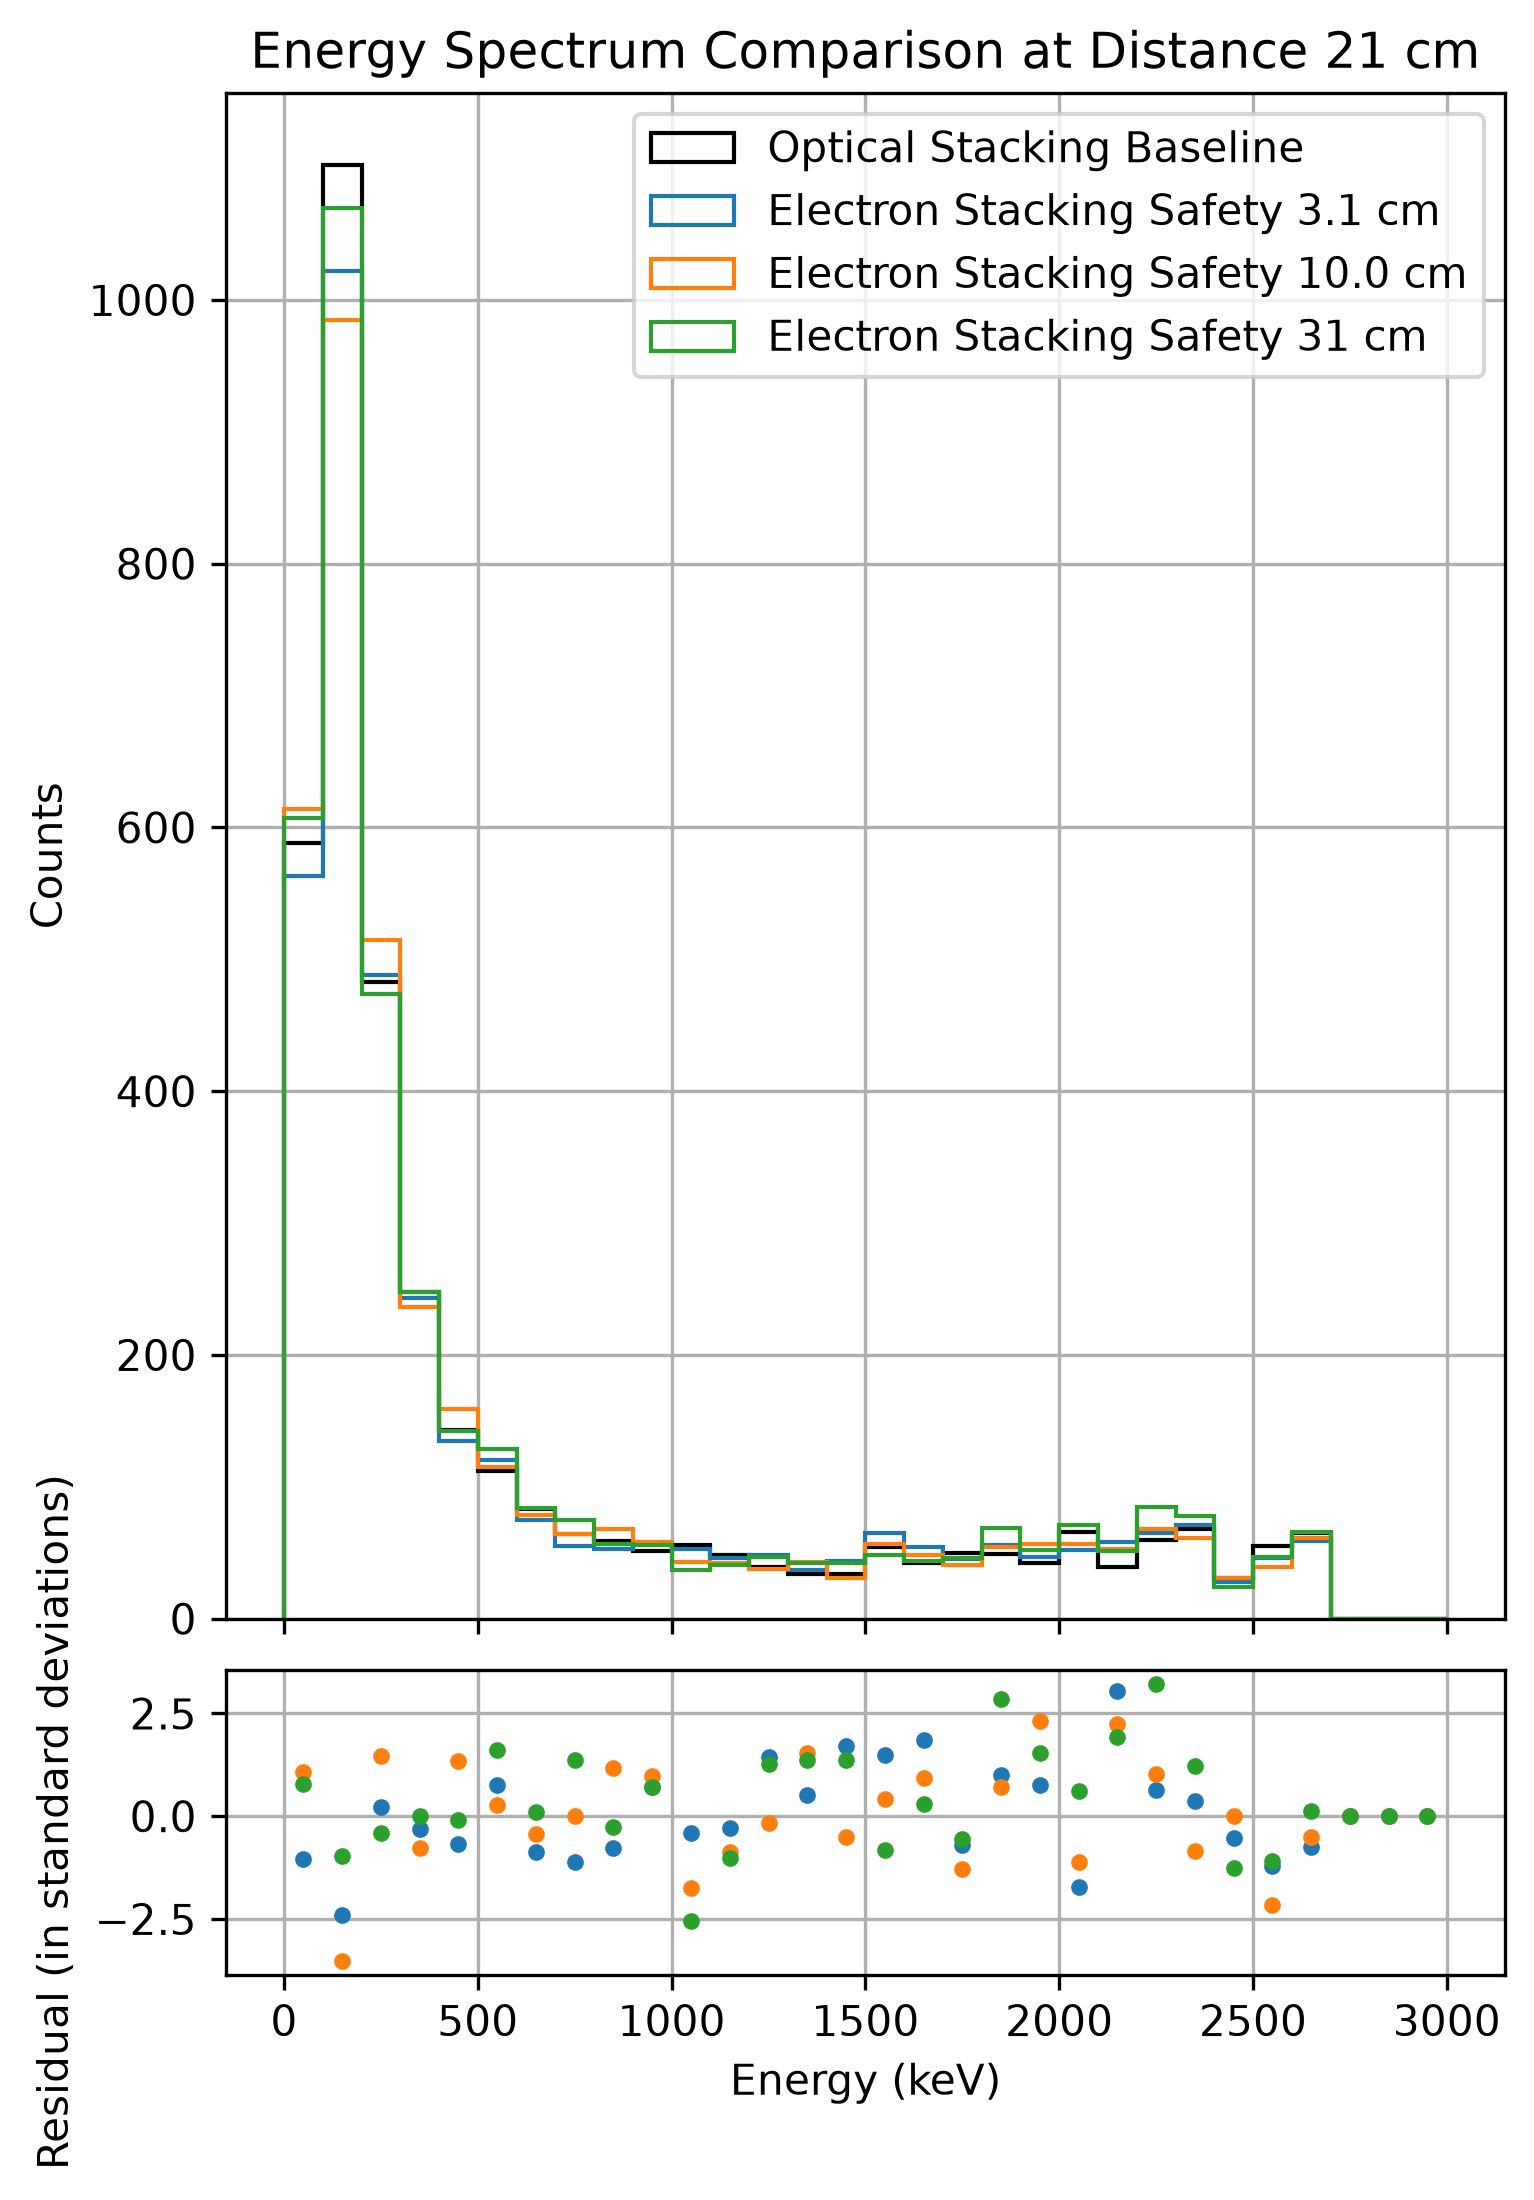
As above, source 21 cm from the detector.
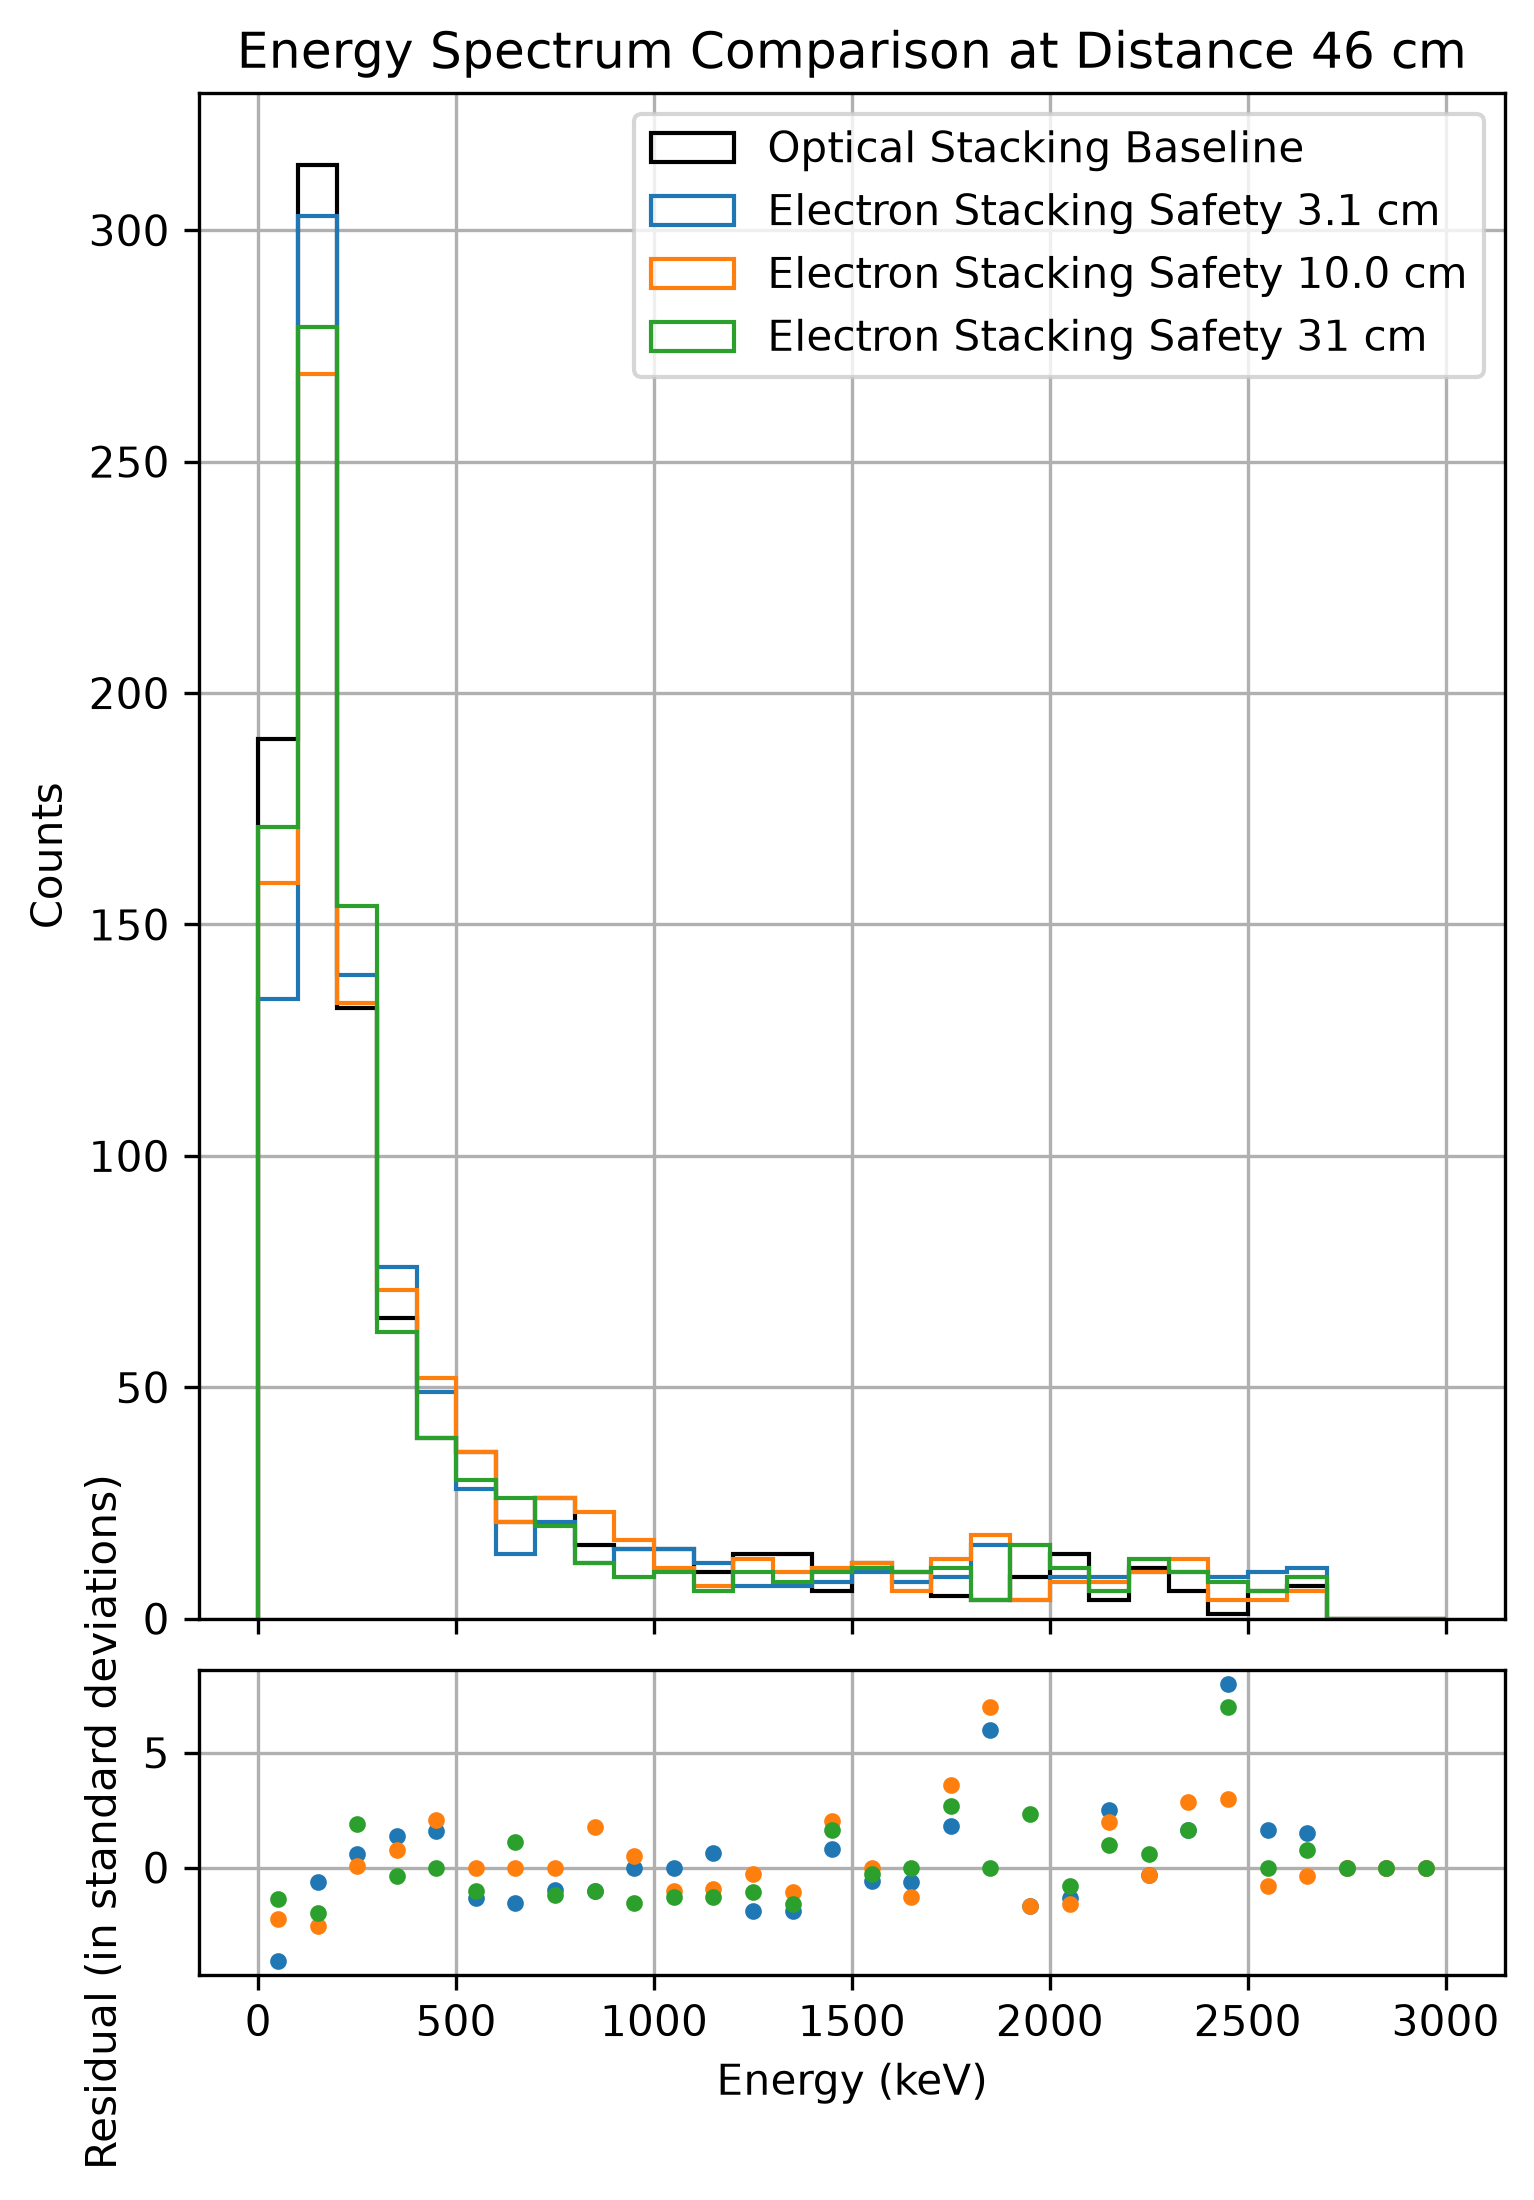
As above, source 46 cm from the detector.