HPGe tracking and observables
This section of the validation report involves basic simulations of particles in Germanium relevant for HPGe detectors. We focus on computing observables of interest for HPGe detectors. The dependence of these observables on user inputs, for example:
step limits,
production cuts,
physics lists,
is computed, allowing for a user to determine appropriate choices for their simulation.
The geometry is based on a cylinder of natural Germanium (height and radius both 4 cm), emersed in a liquid argon sphere, with a small Fe calibration source above the detector.
This geometry is shown below, for gamma particles generated in the source.
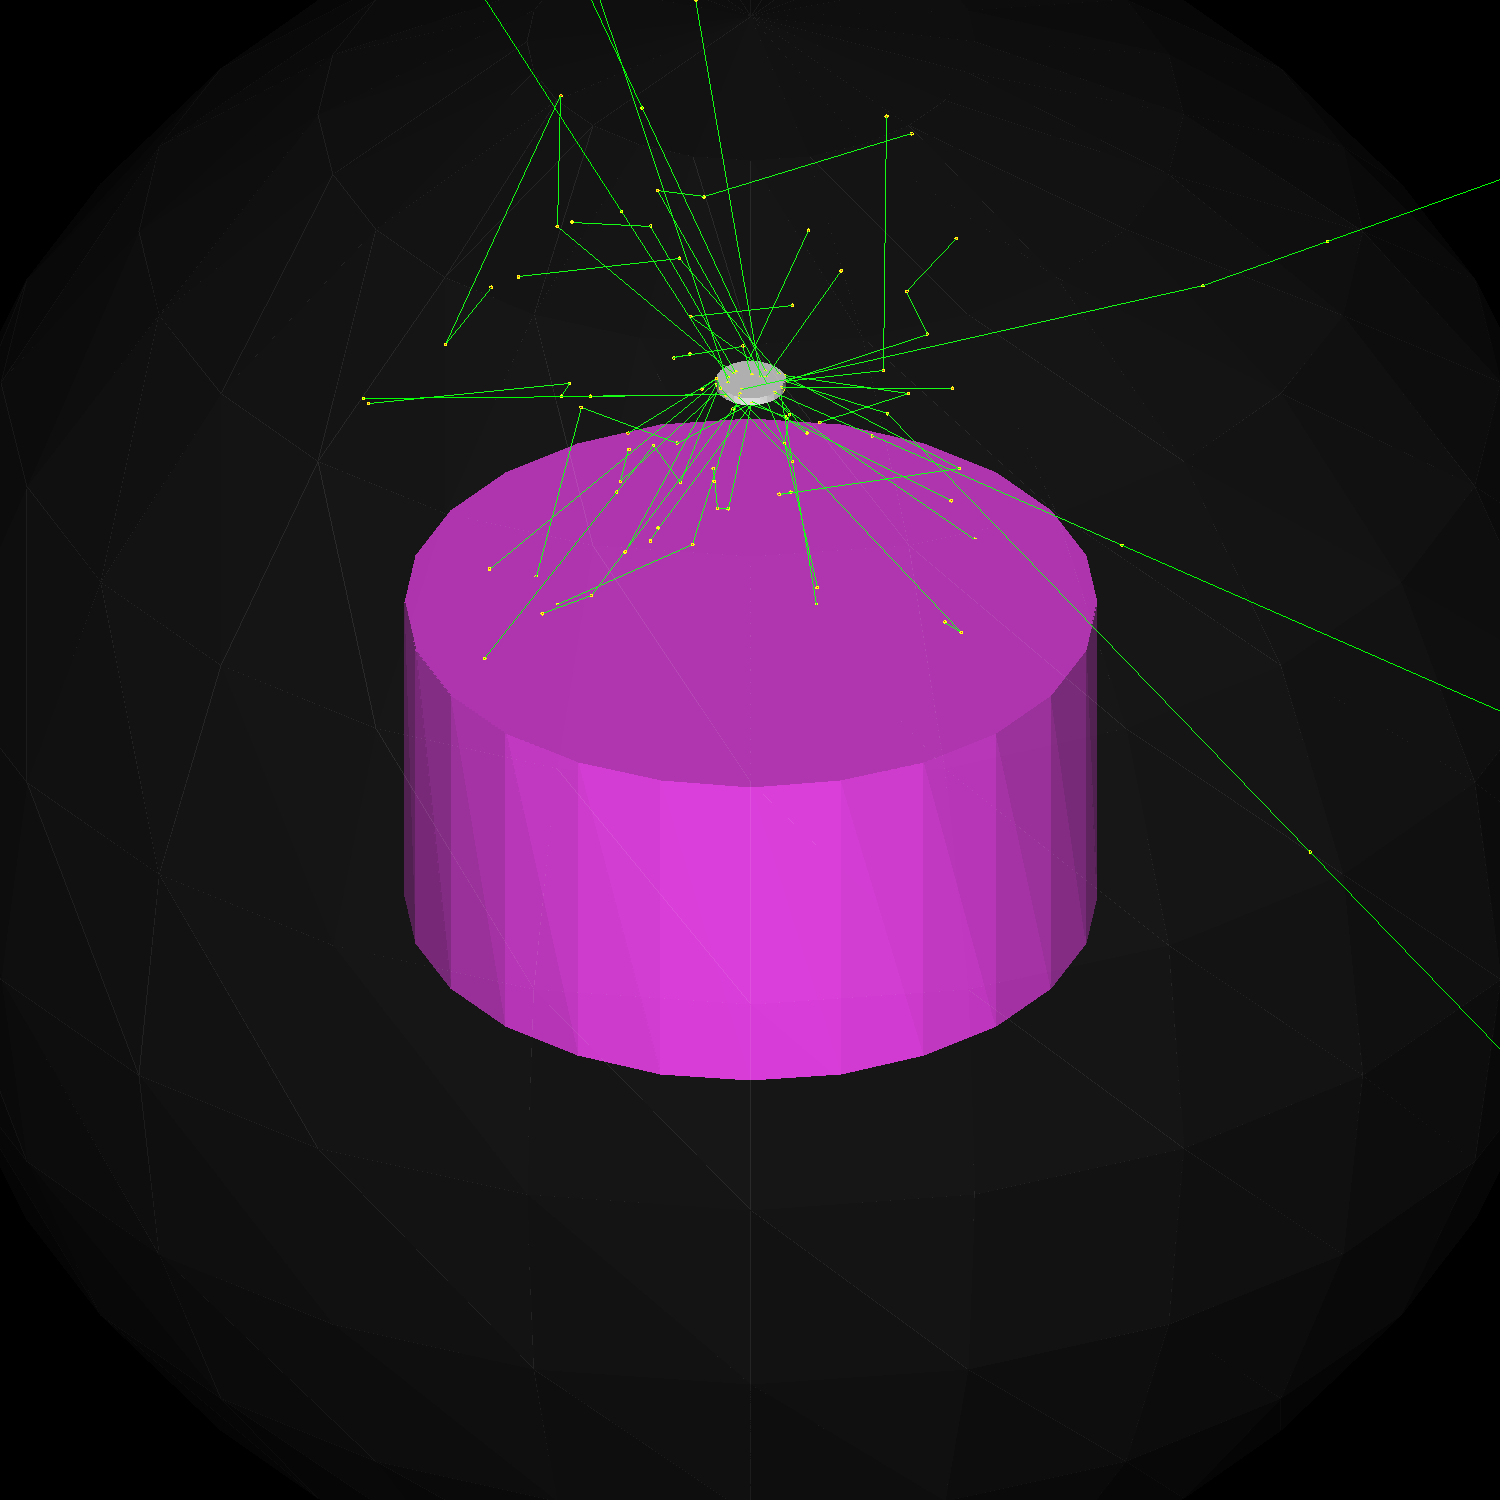
Geometry for the tests on Ge observables, gamma primaries are generated in the source (shown in white).
Electron tracking plots
We generate electrons uniformly in the bulk of the Germanium. This is performed both for a variety of step limits and production cuts.
Step limits are a user defined limitation on the maximum step length for tracking charged particles, for more details see [geant4-docs].
Production cuts are a limit on the range of secondary particles to be produced, particles with a range below this will not be produced (and the energy will be dumped into the current volume), for more details see [geant4-docs].
We generate 1 MeV electrons and plot the steps for geant4, both without step limits and with 10 um step limitations.
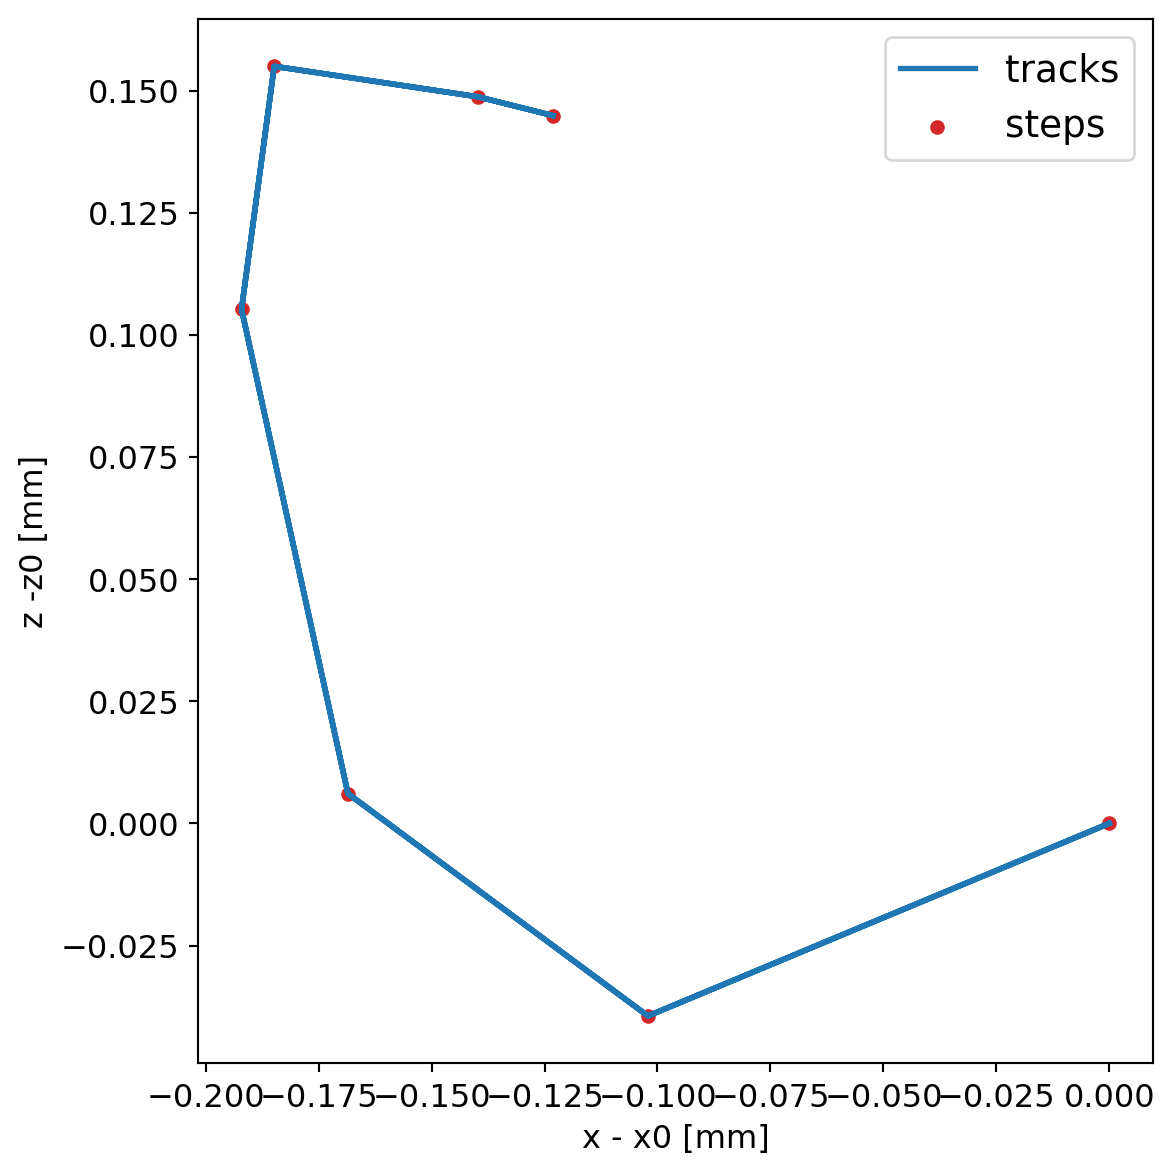
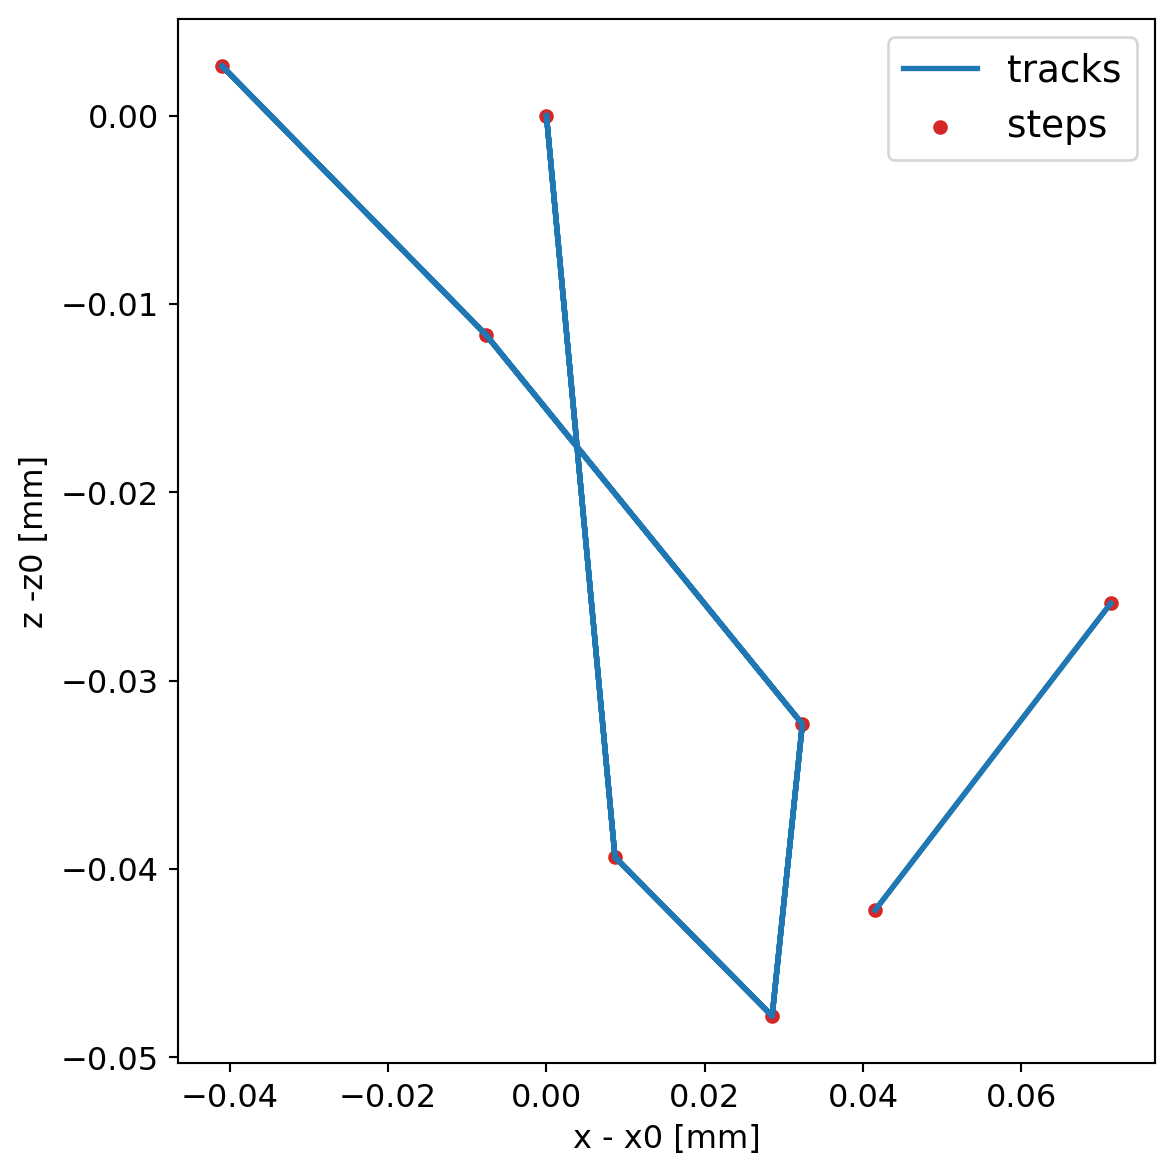
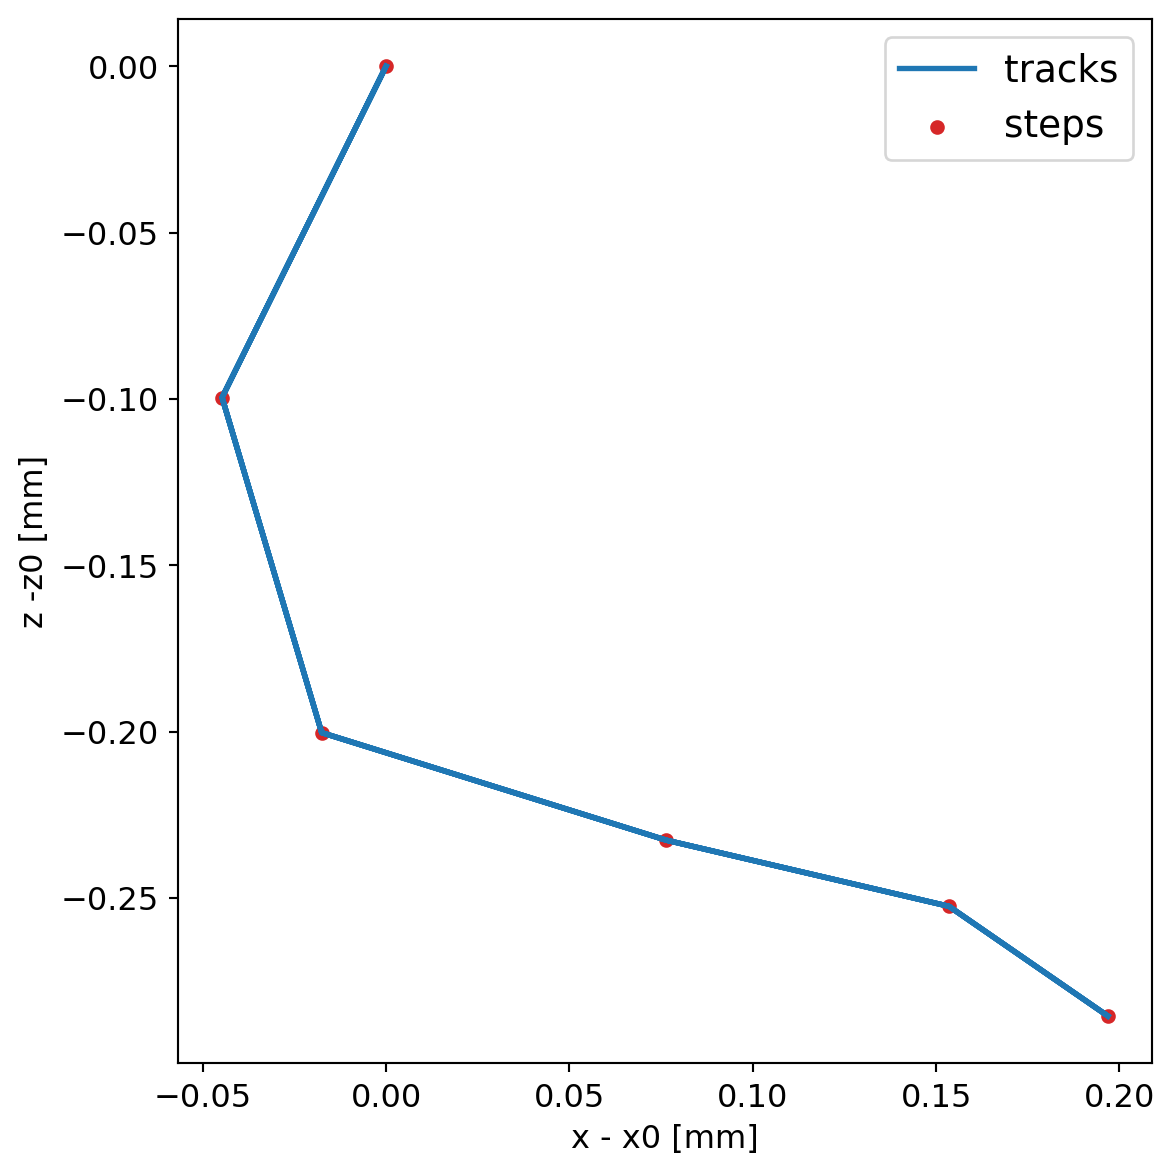
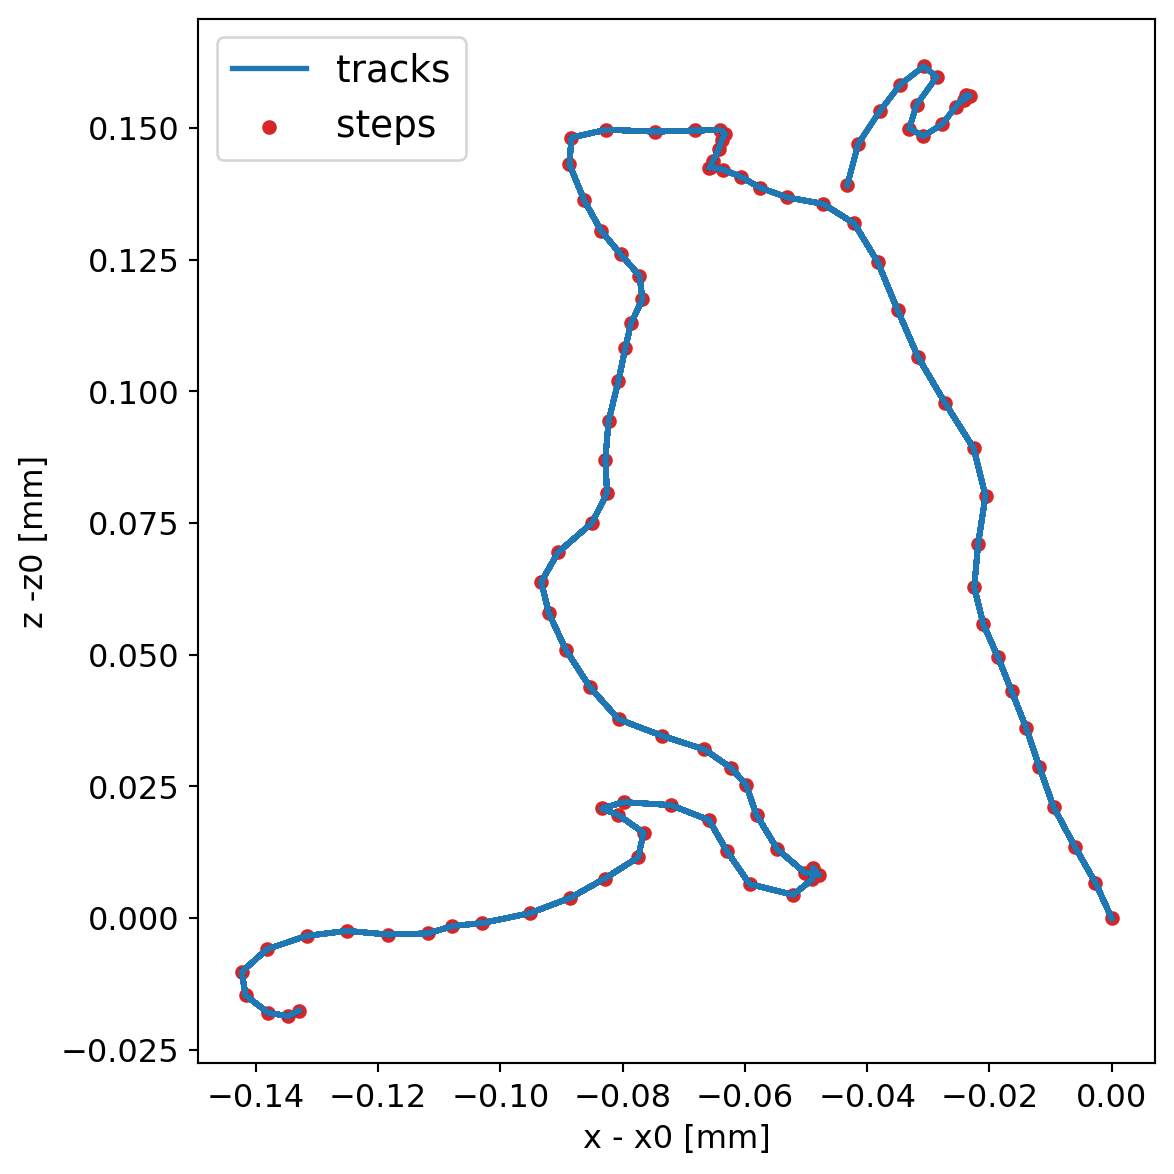
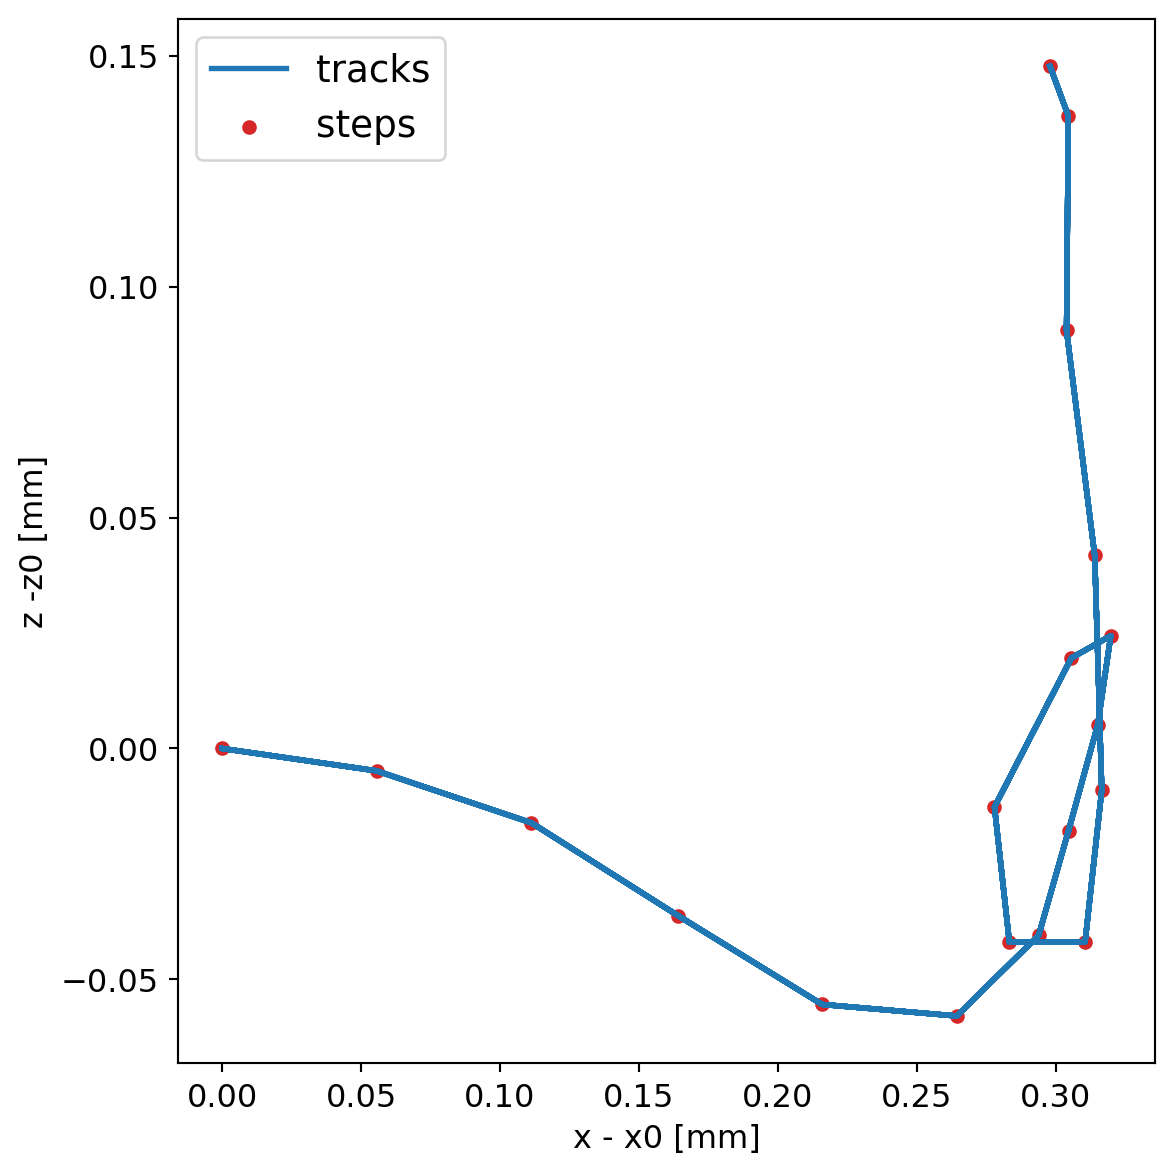
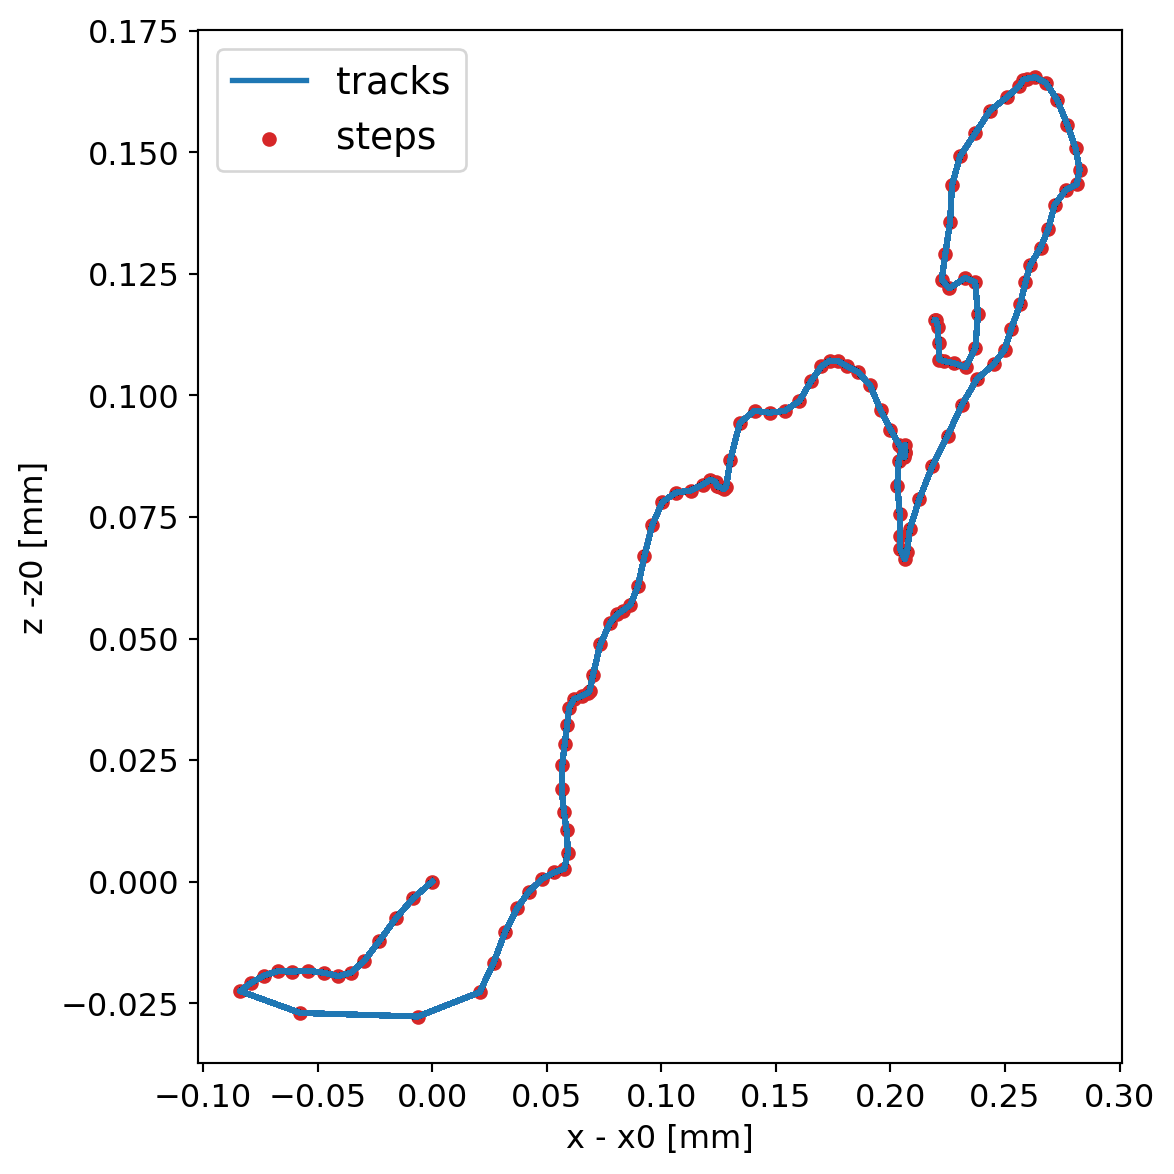
Plots of the x and z position of 1 MeV electrons in the bulk volume of Germanium, the first row gives tracks without step limits (the default in Geant4) while the second row uses 10 um step limits. You should see constrained electron tracks (with fine stepping in the second case). There is also the possibility to see some isolated steps / tracks due to Bremsstralhung.
Next we plot the distribution of step lengths, and the joint distribution with the distance of the steps to the detector surface. This is shown for a large range of distances and also zooming into events close to the surface.
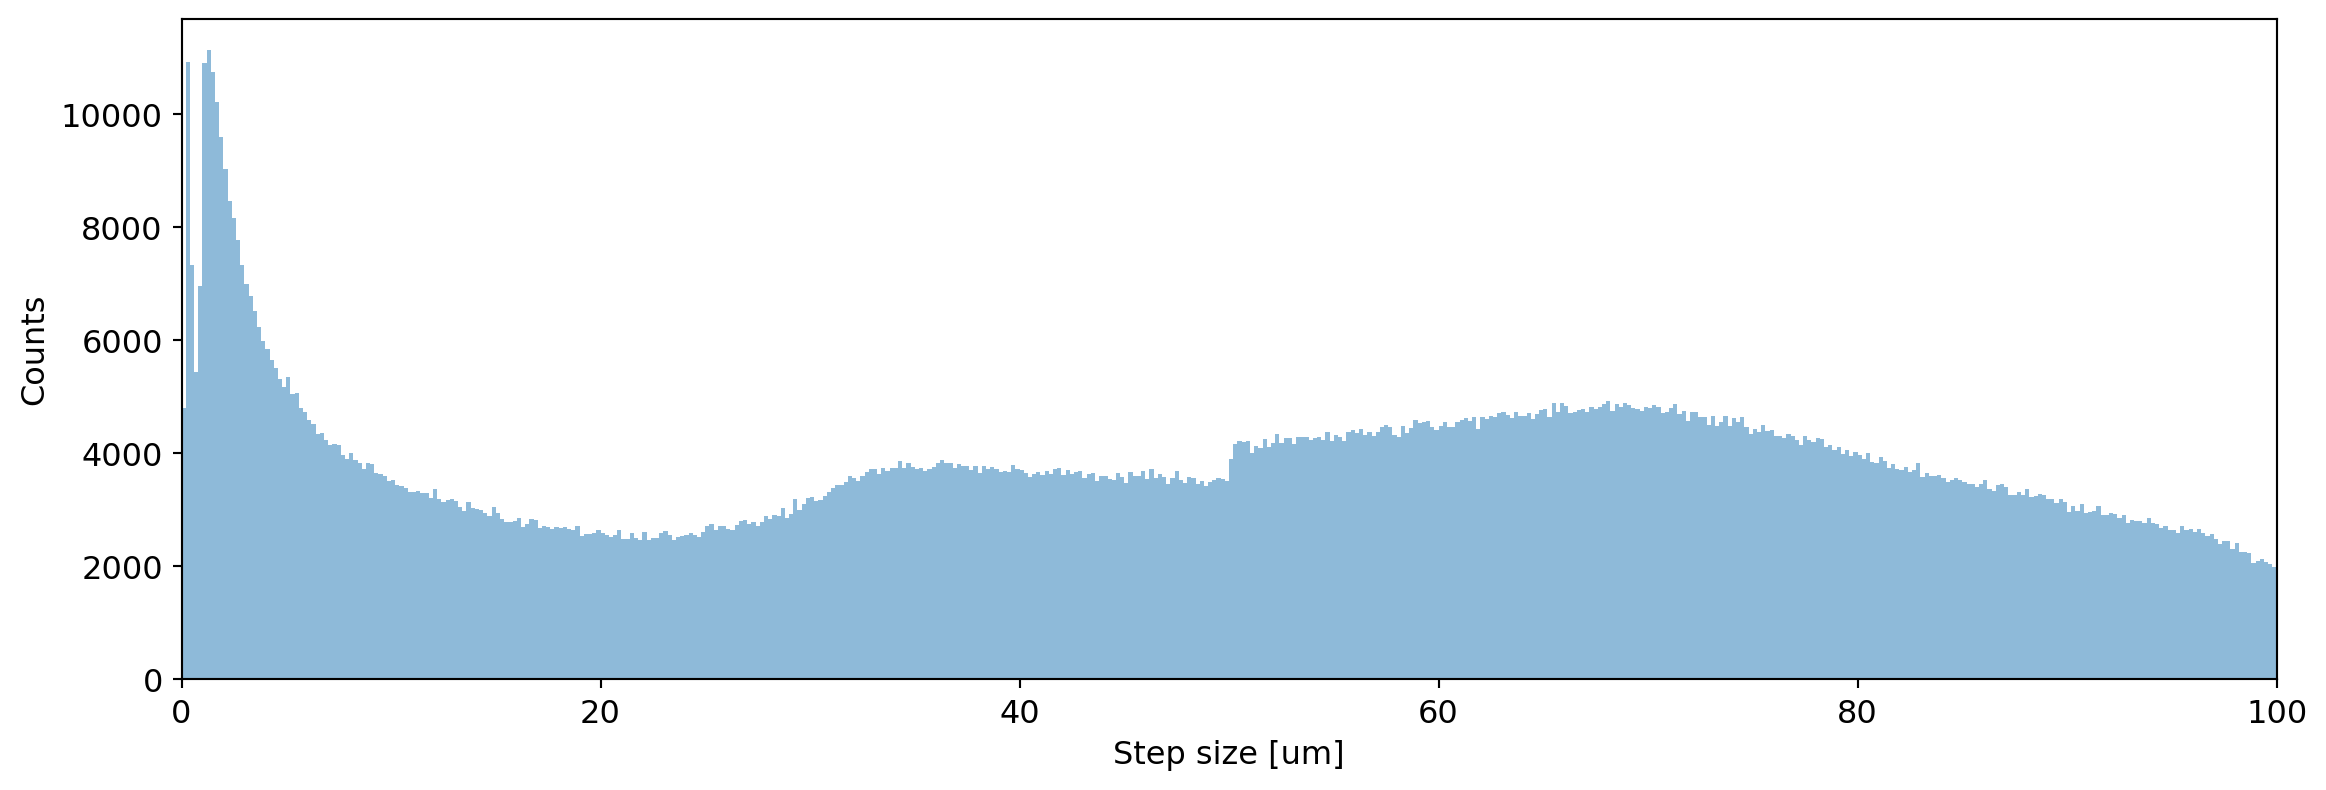
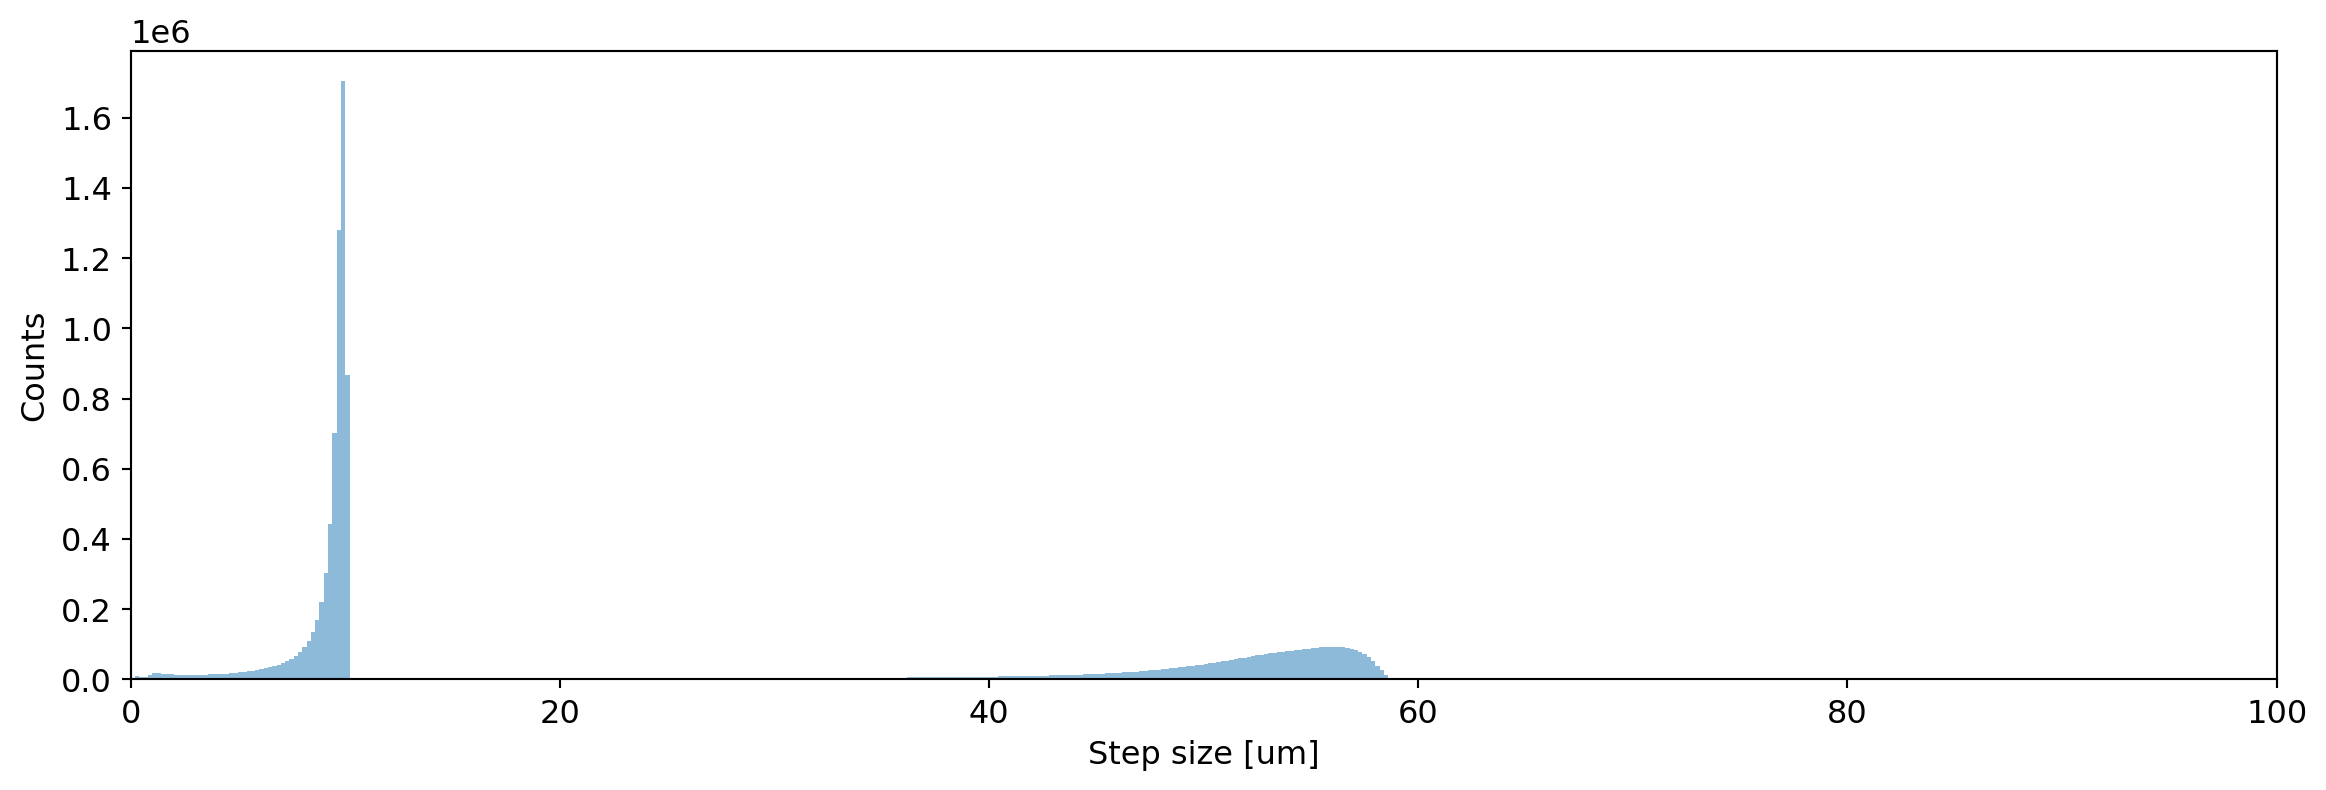
Step length distributions for 1 MeV electrons in Germanium. You should see the step lengths be limited to 10 um in the second case.
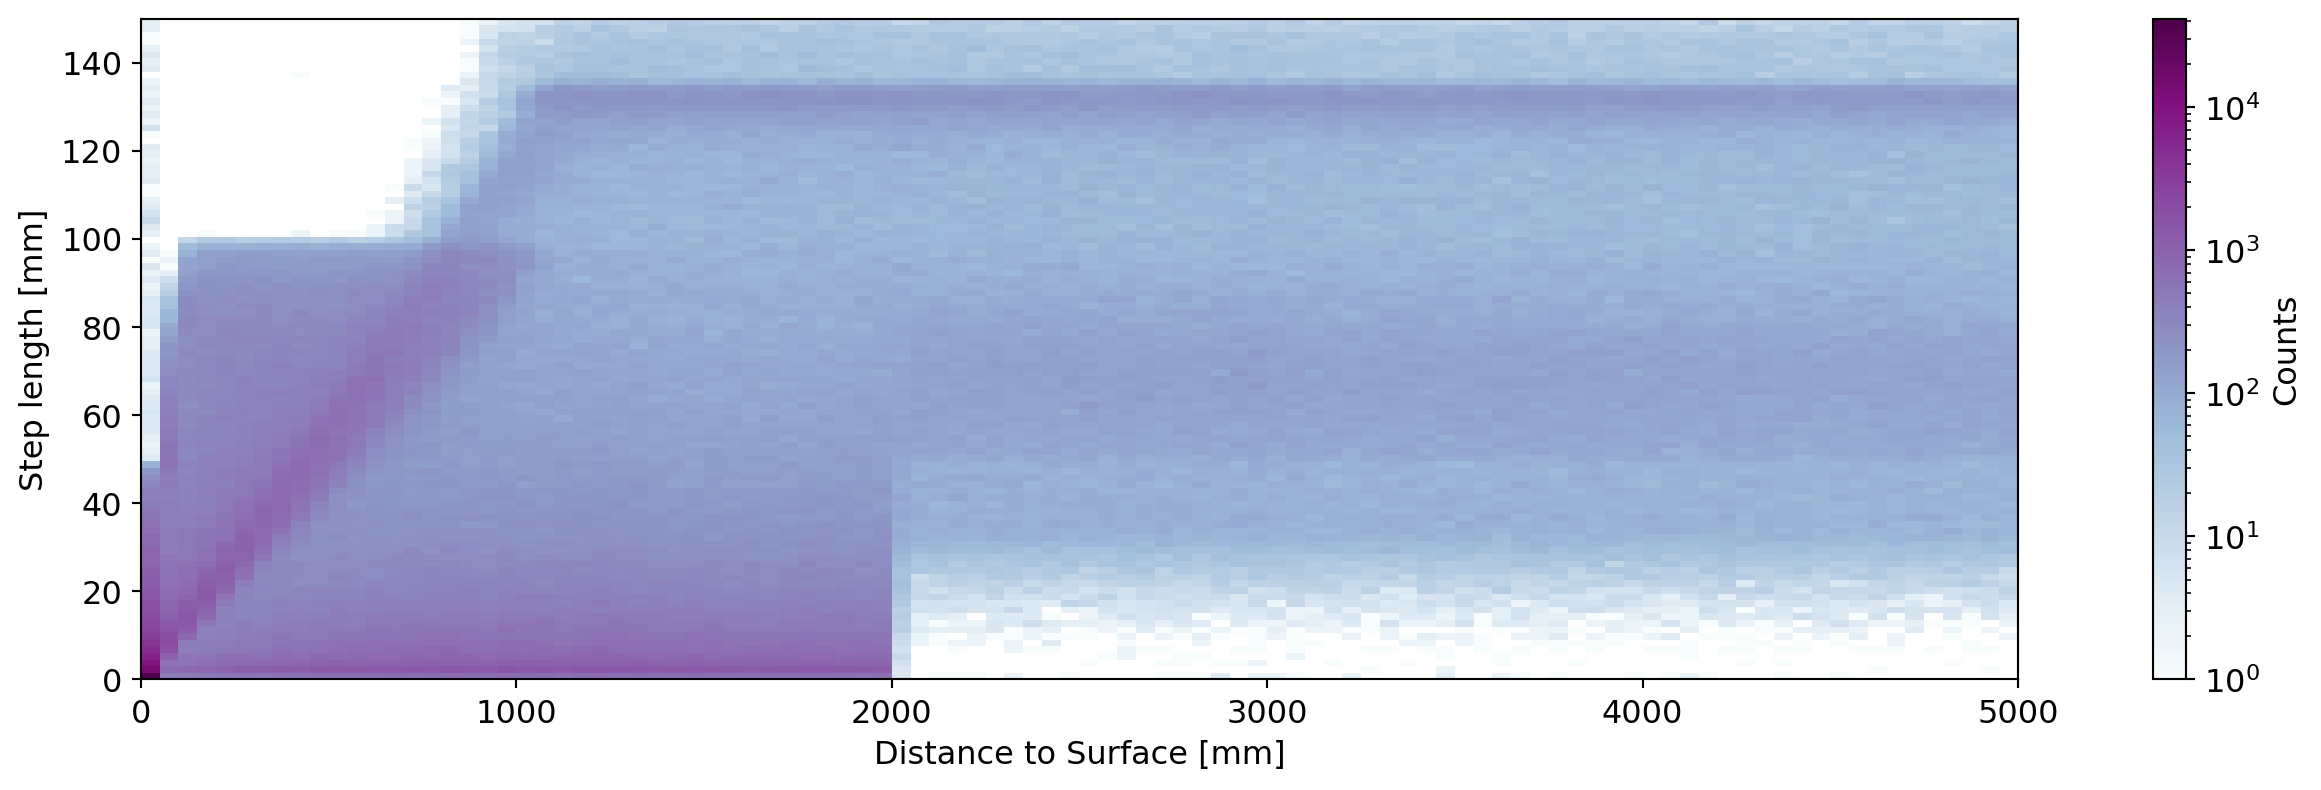
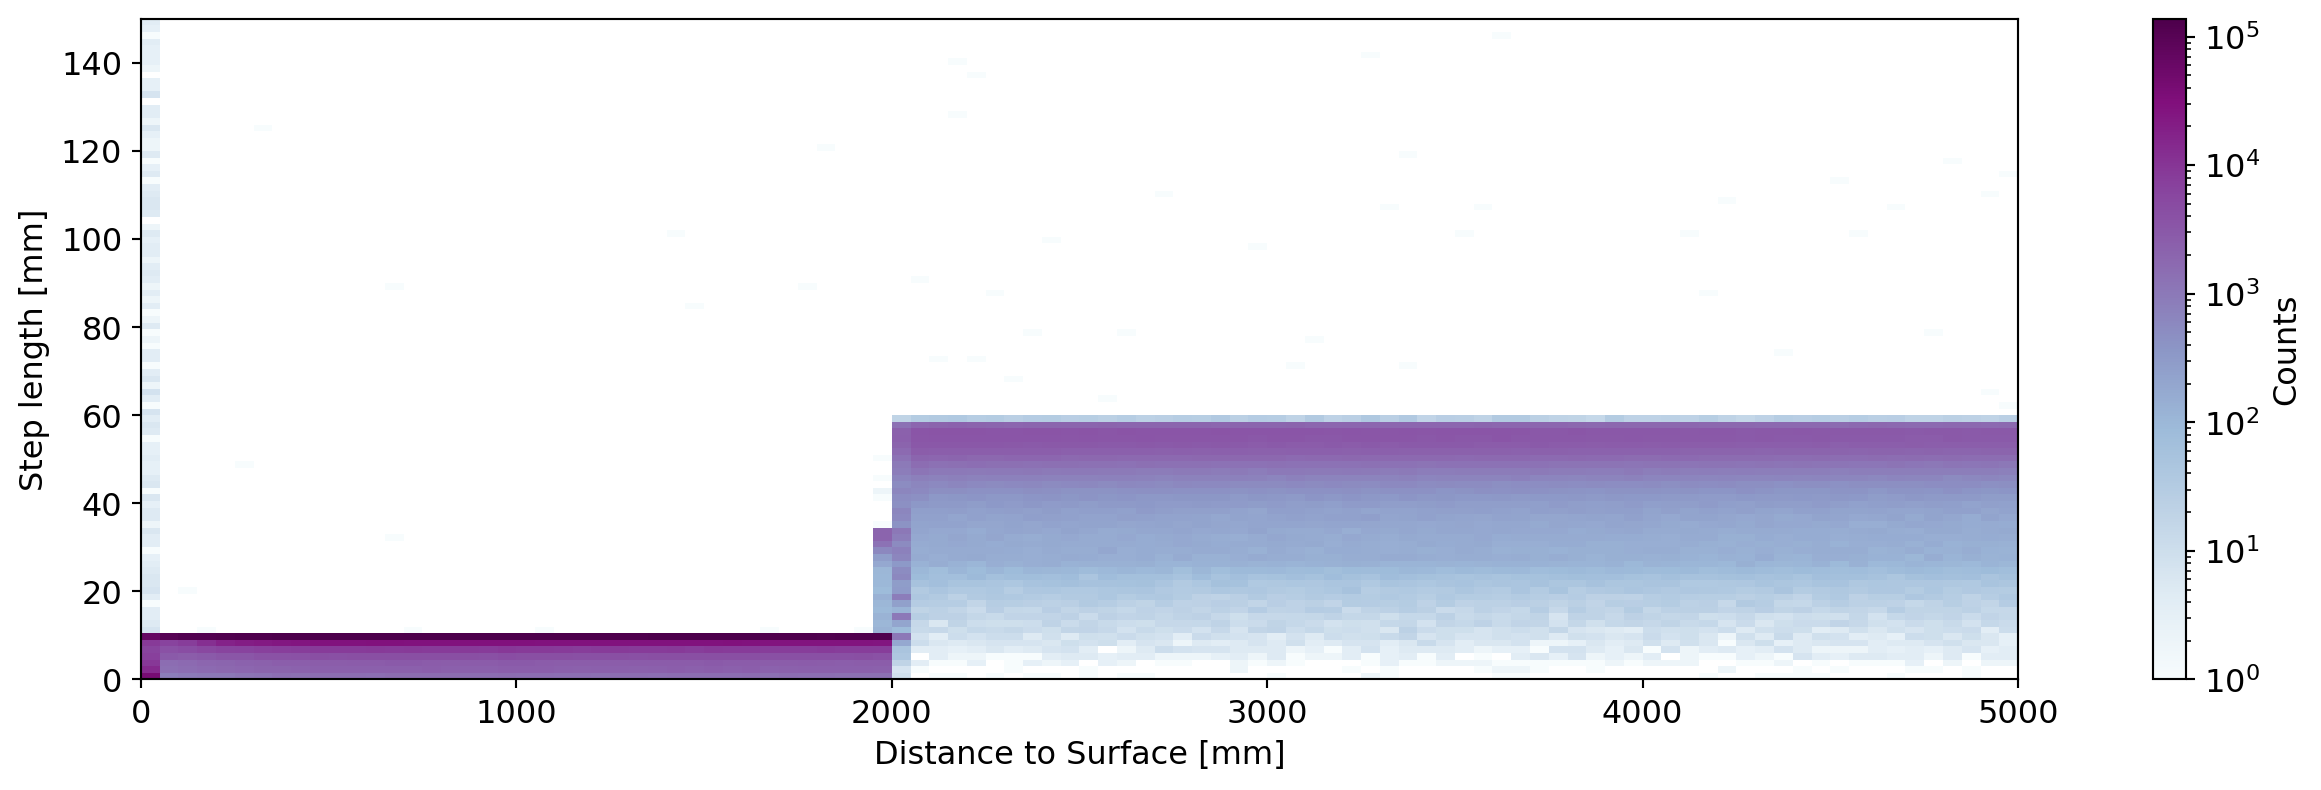
Joint distribution of step length and distance to detector surface for 1 MeV electrons in Germanium. Without step limits you should see step limits smaller close to the detector surface, due to the safety mechanism in Geant4. Two populations of events are expected to be present due to the multiple column scatter (MSC) and Ionisation processes in Geant4. With step limits the step lengths should be limited to 10 um.
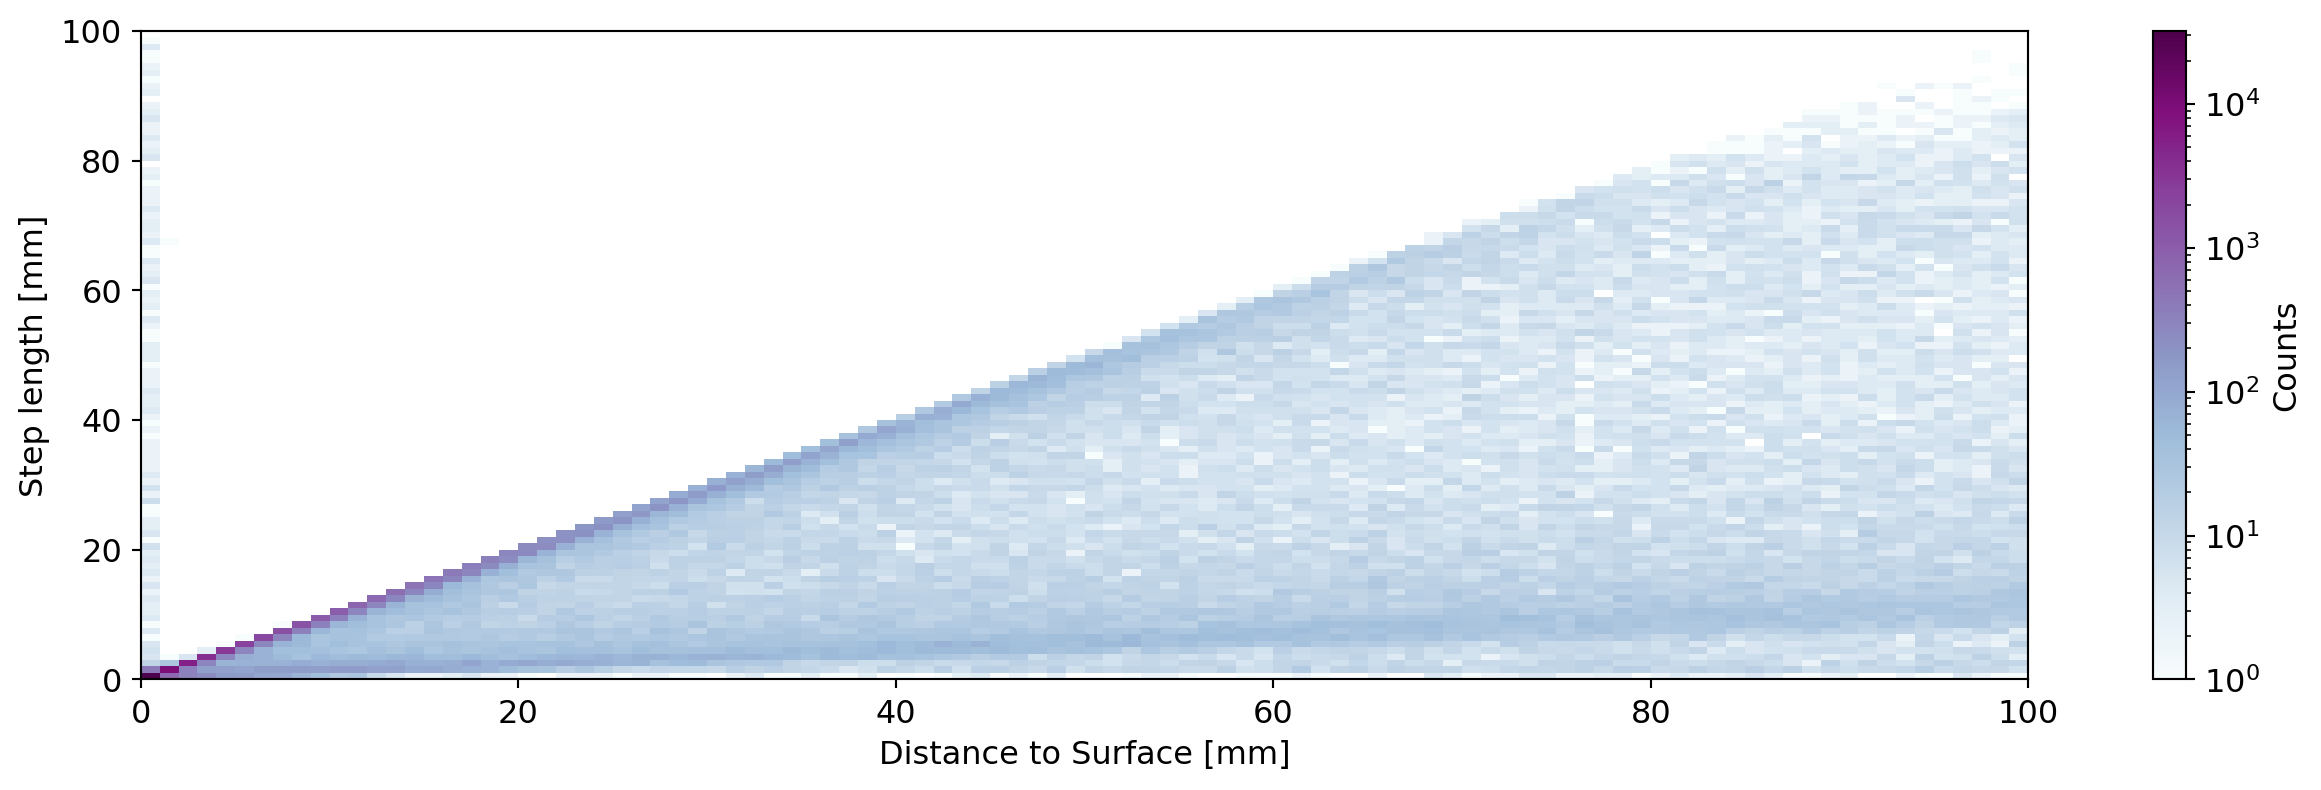
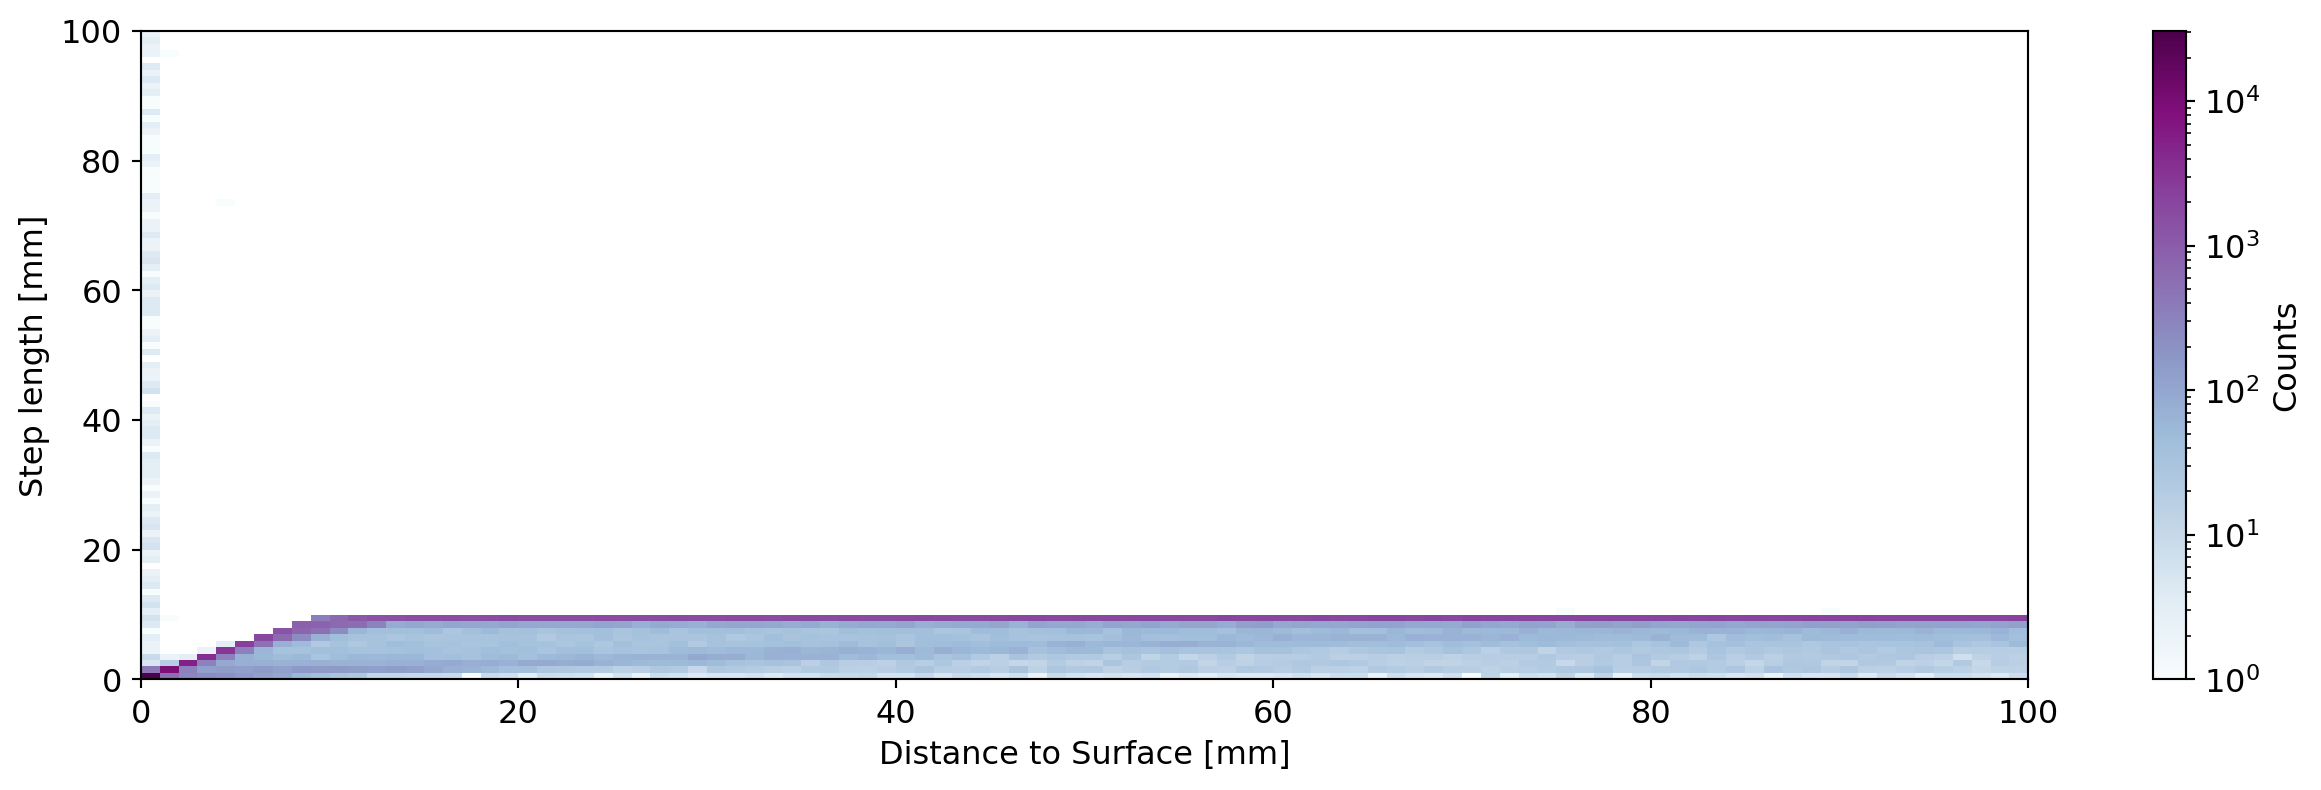
Joint distribution of step length and distance to detector surface for 1 MeV electrons in Germanium zooming into small distances. Similar trends as in the previous plot should be present.
Step limits effect on observables
The next section of the validation report describes the calculation of observables of interest relevant for Germanium detectors, this consists of:
the energy deposited in the Germanium, both with and without active volume correction.
pulse shape heuristics, or parameters describing the topology of the event, (not really observables but relating to pulse shape parameters).
attenuation of external gammas.
We compare the simulated observables with the step limits used in the simulation.
Bulk electrons
We generate 1 MeV electrons in the bulk of the Germanium detector varying the step limits and production cuts. This is relevant both for the simulation of neutrinoless double beta decay but also any gamma’s depositing energy in the HPGe. This is since a change in the fraction of electrons with fully reconstructed energy will change the peak-to-continuum ratio for the gamma simulation.
Total energy
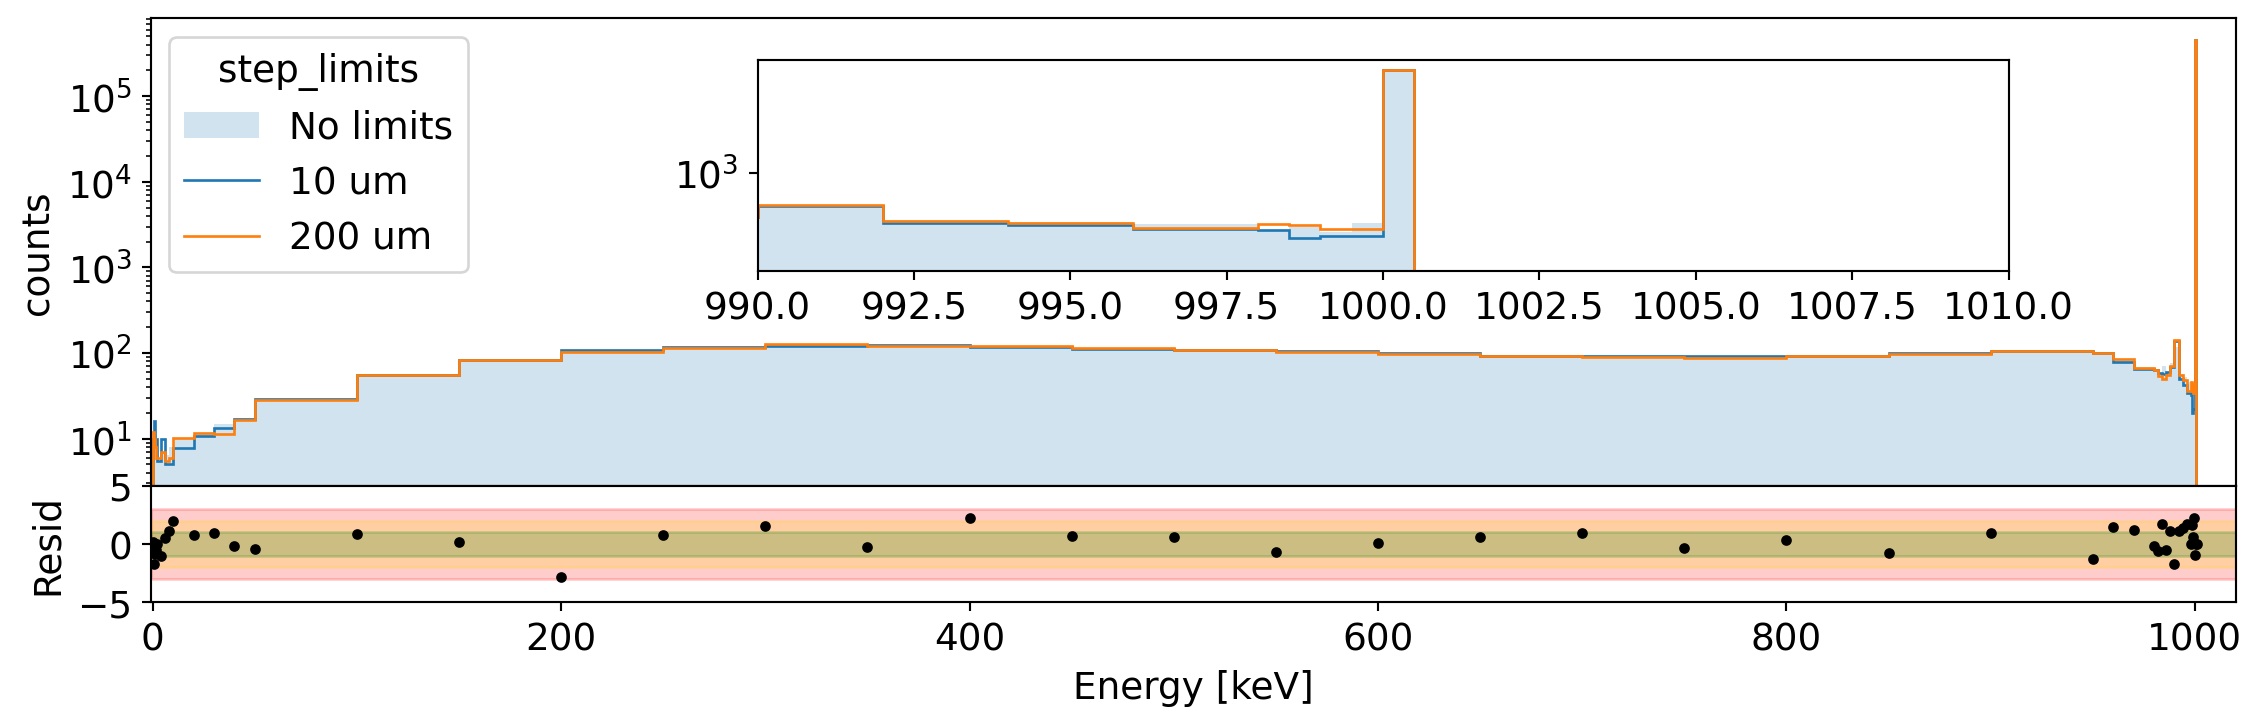
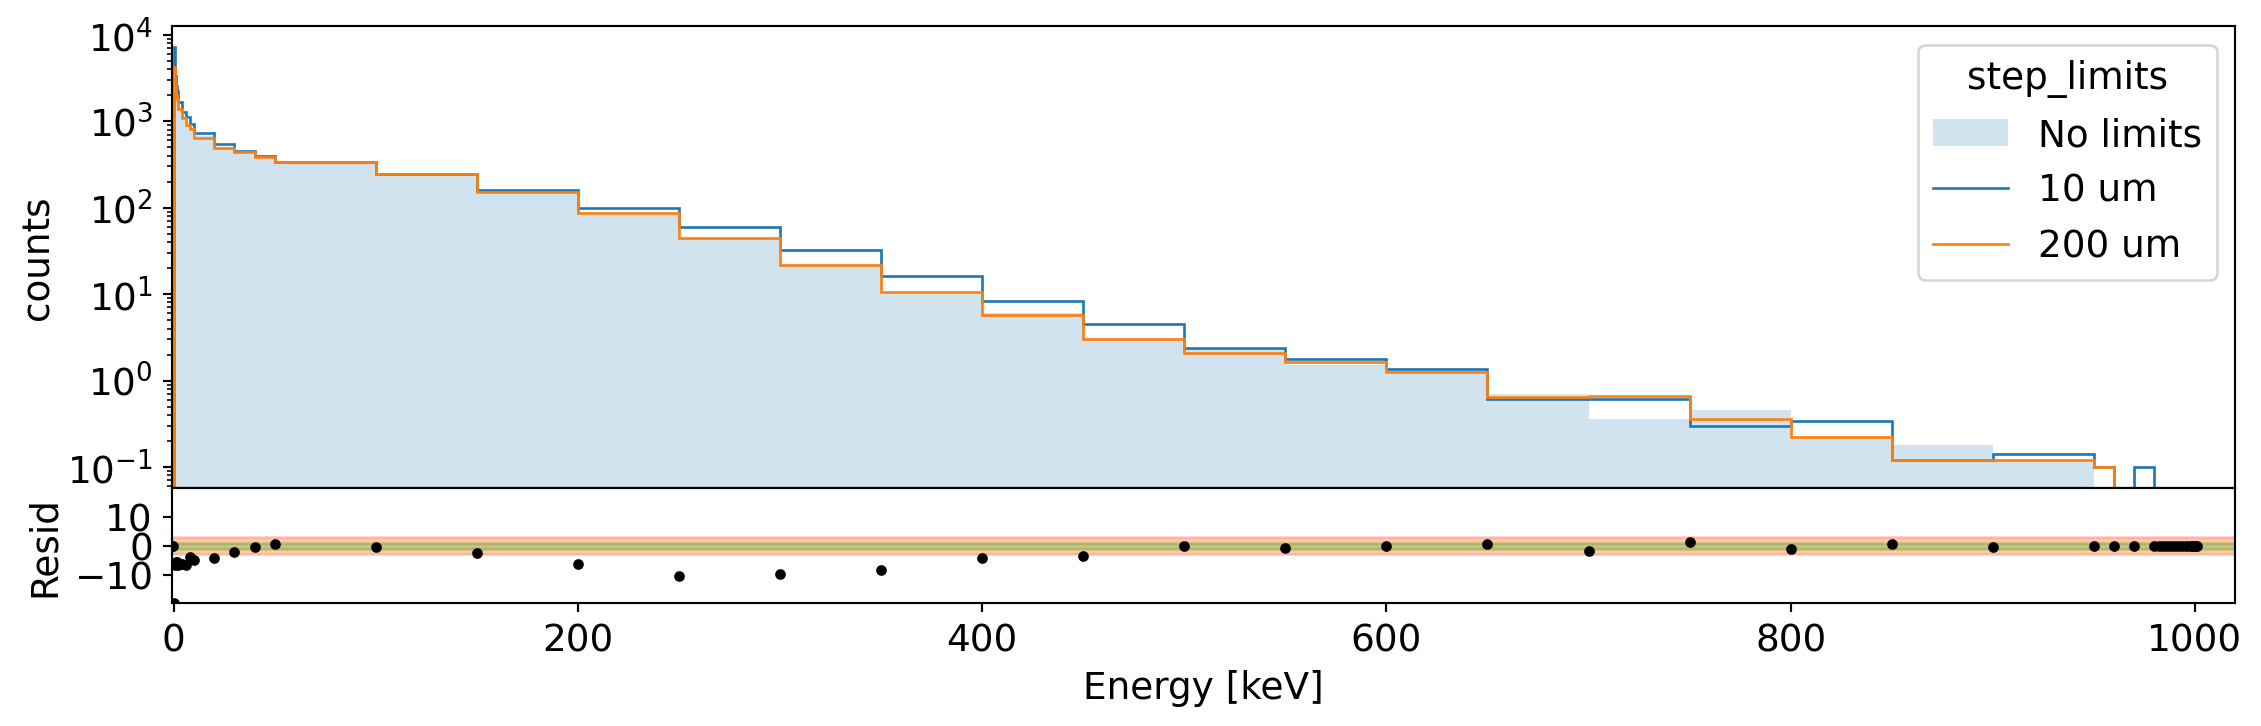
We extract the total energy deposited in the Germanium detector, the energy spectra are plotted below:
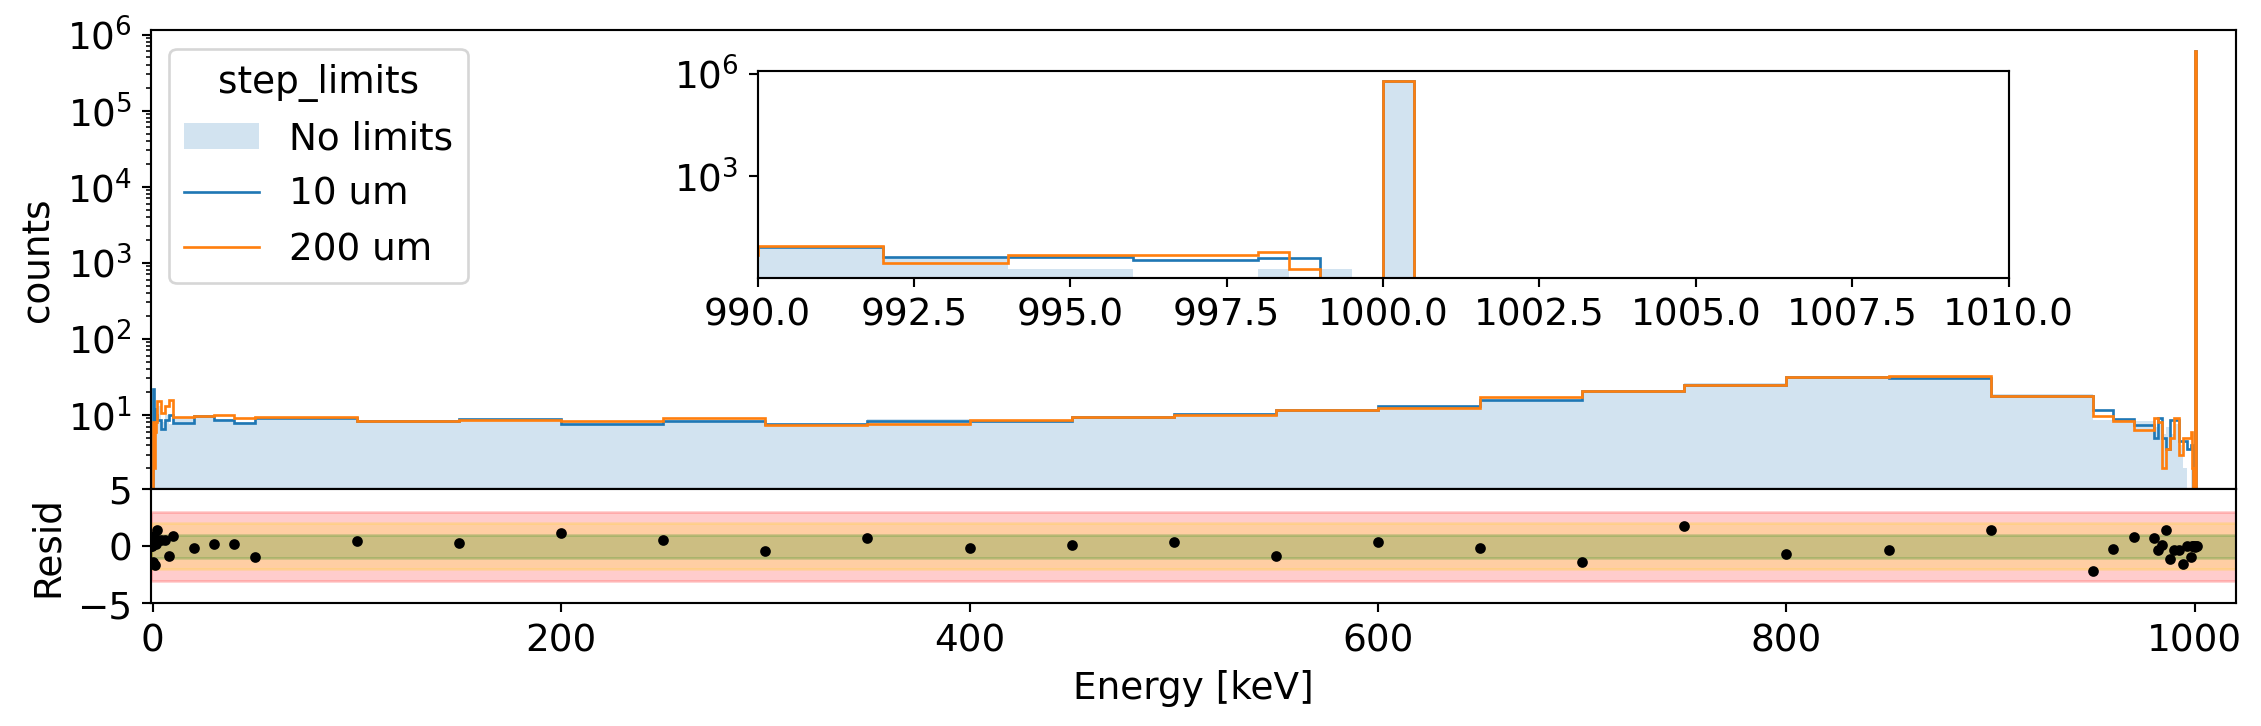
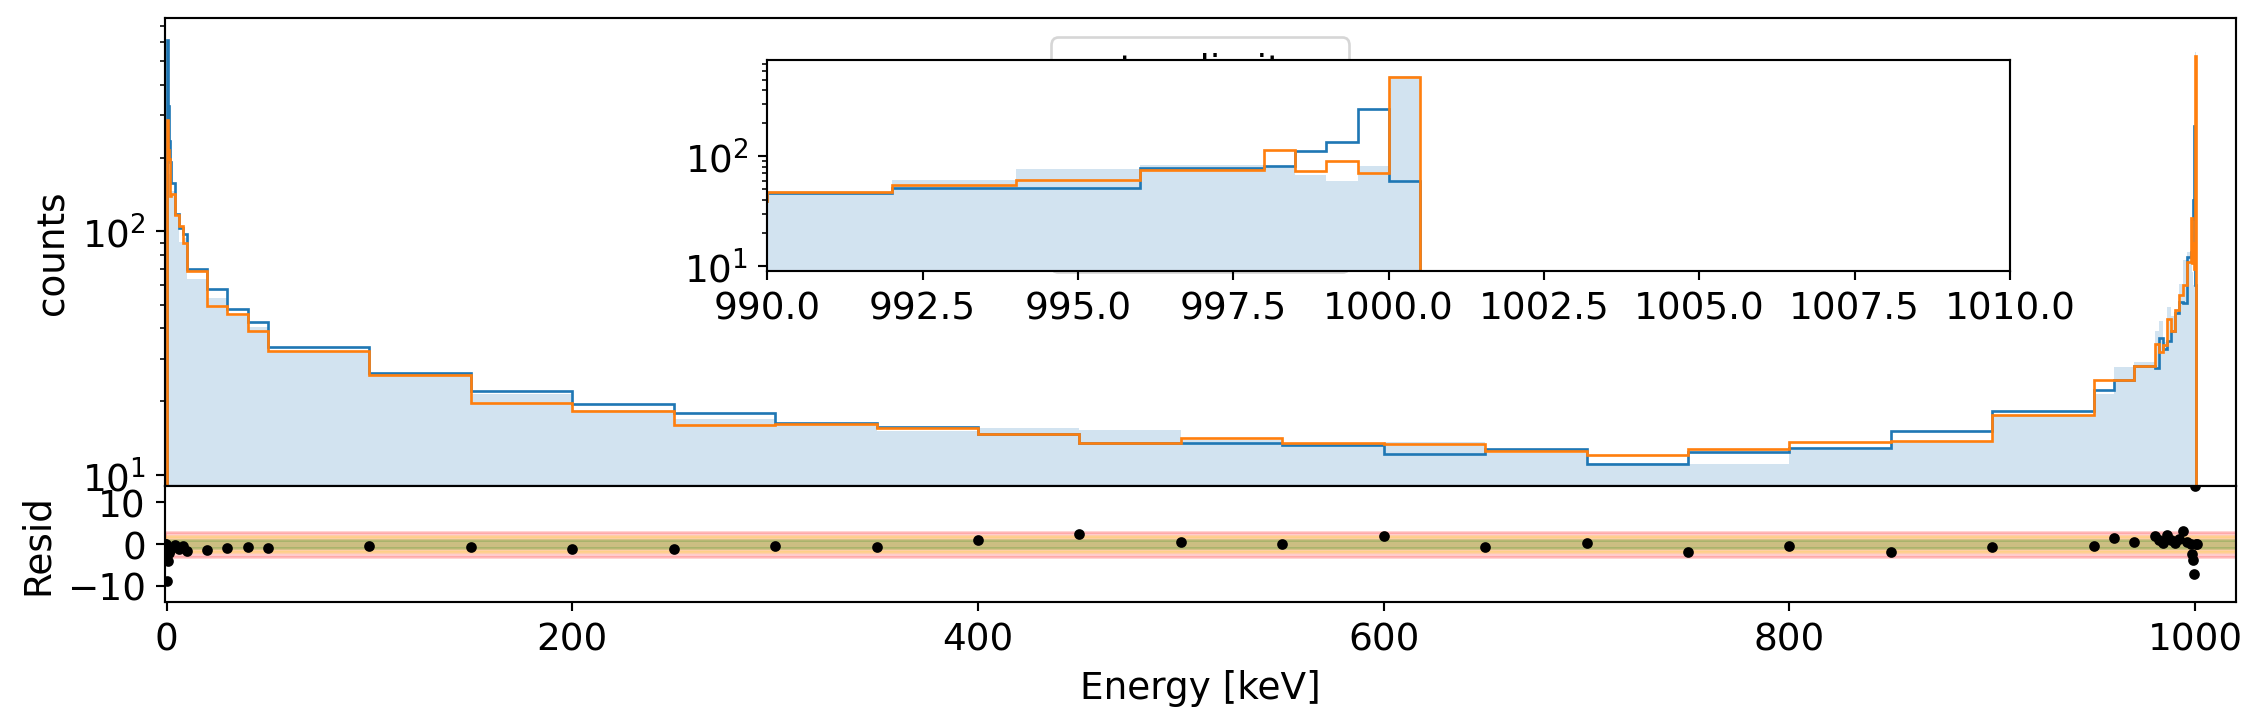
Spectrum of total energy in Germanium for 1 MeV electrons generated uniformly in the volume. We compare the spectrum without step limits to that with 10 um and 200 um limit. The residual shows the difference between the two extreme cases.
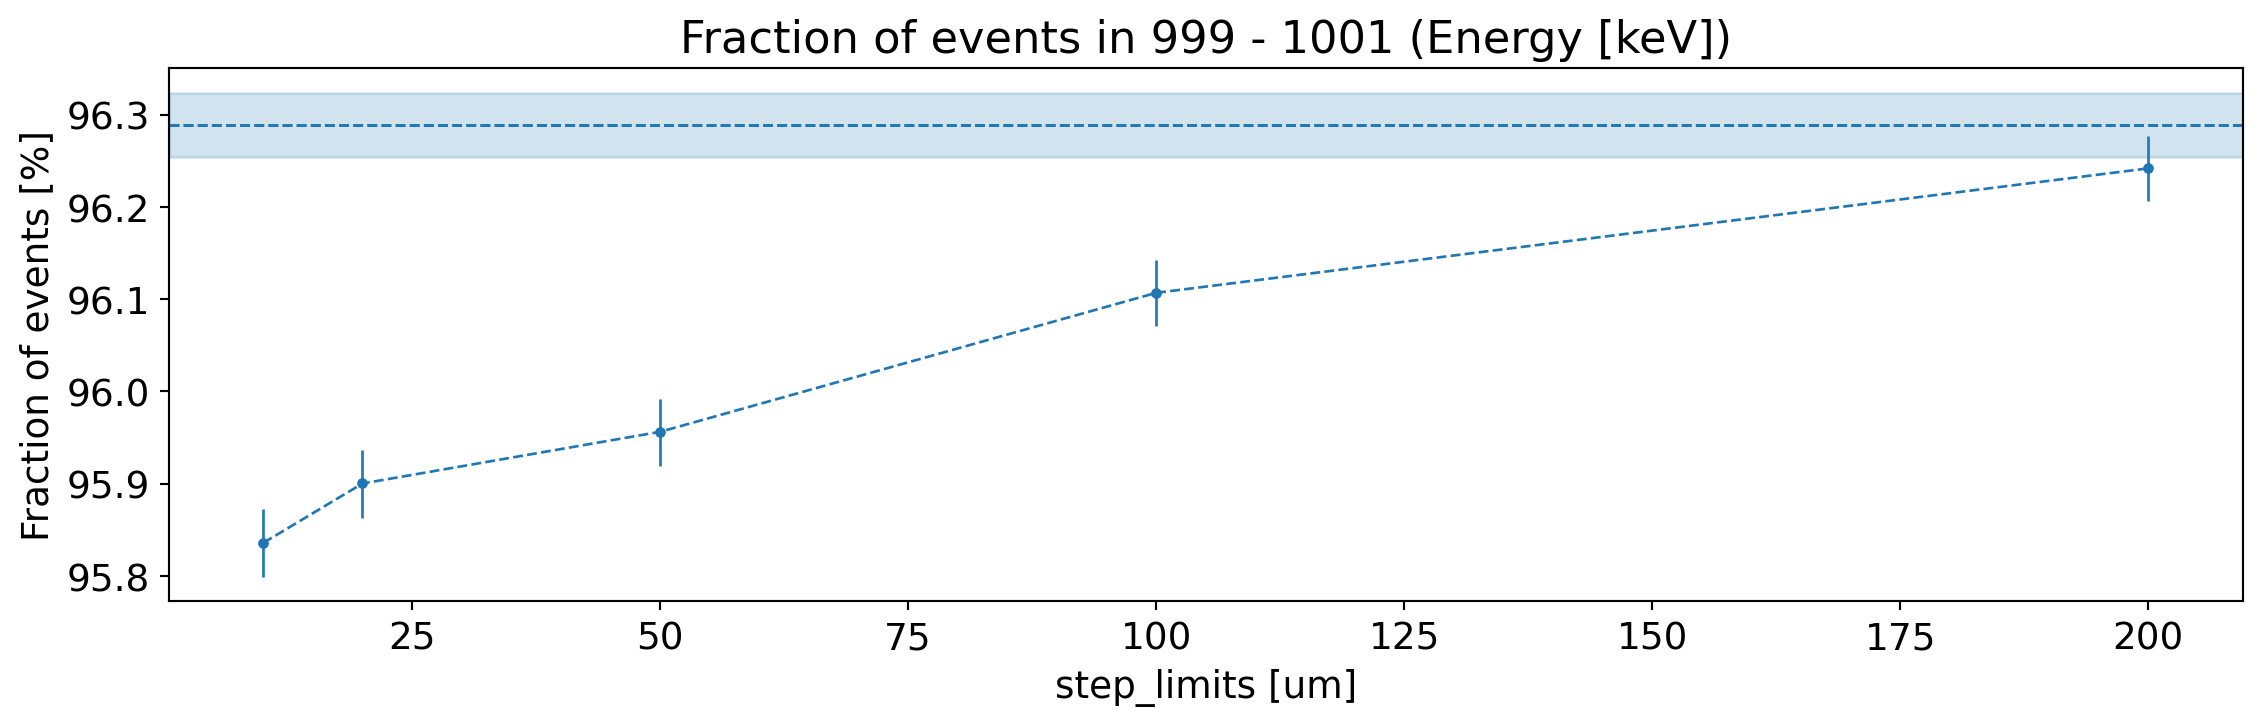
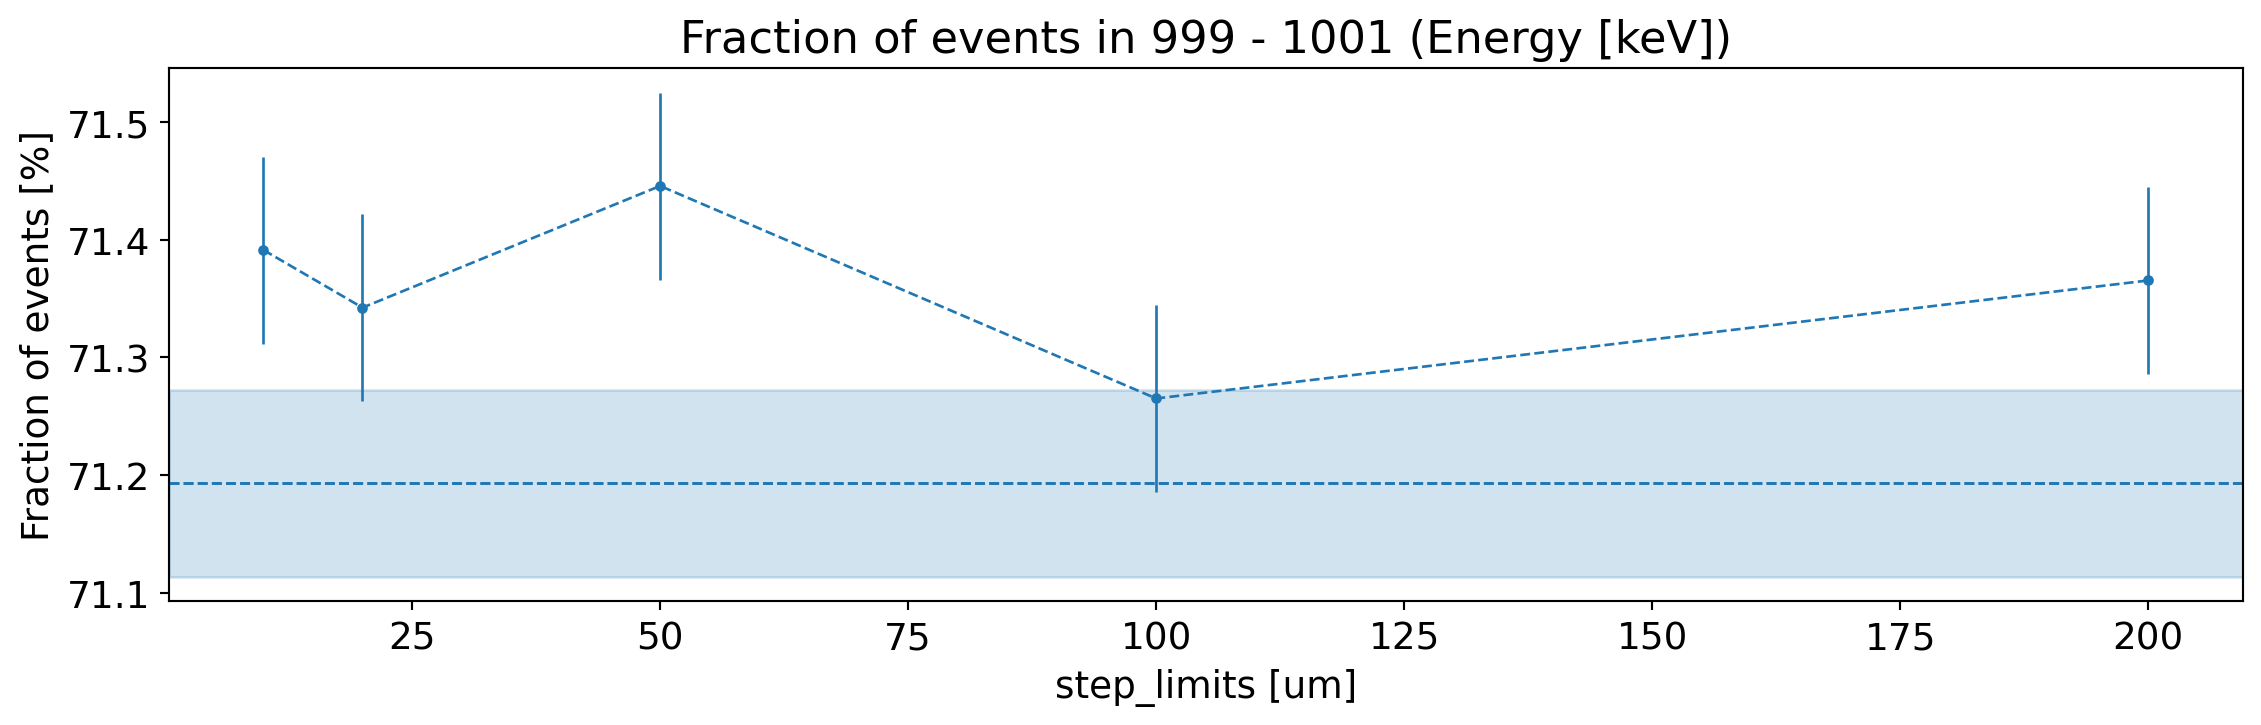
To quantify this we count the fraction of events within 1 keV of the full energy peak.
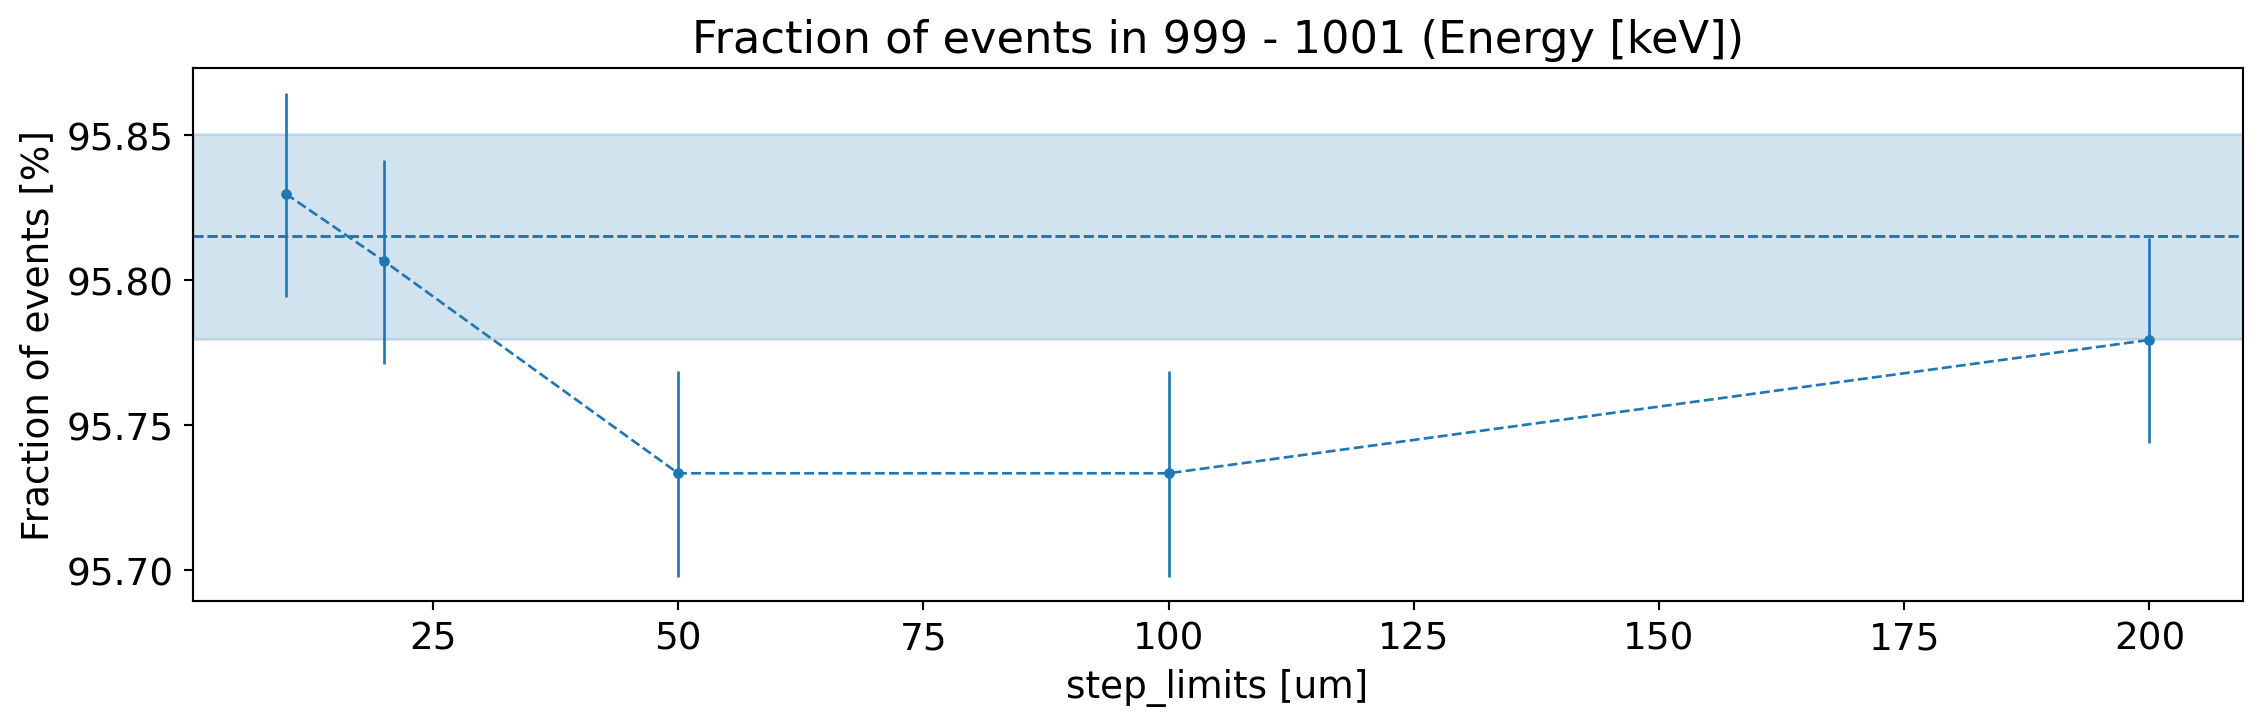
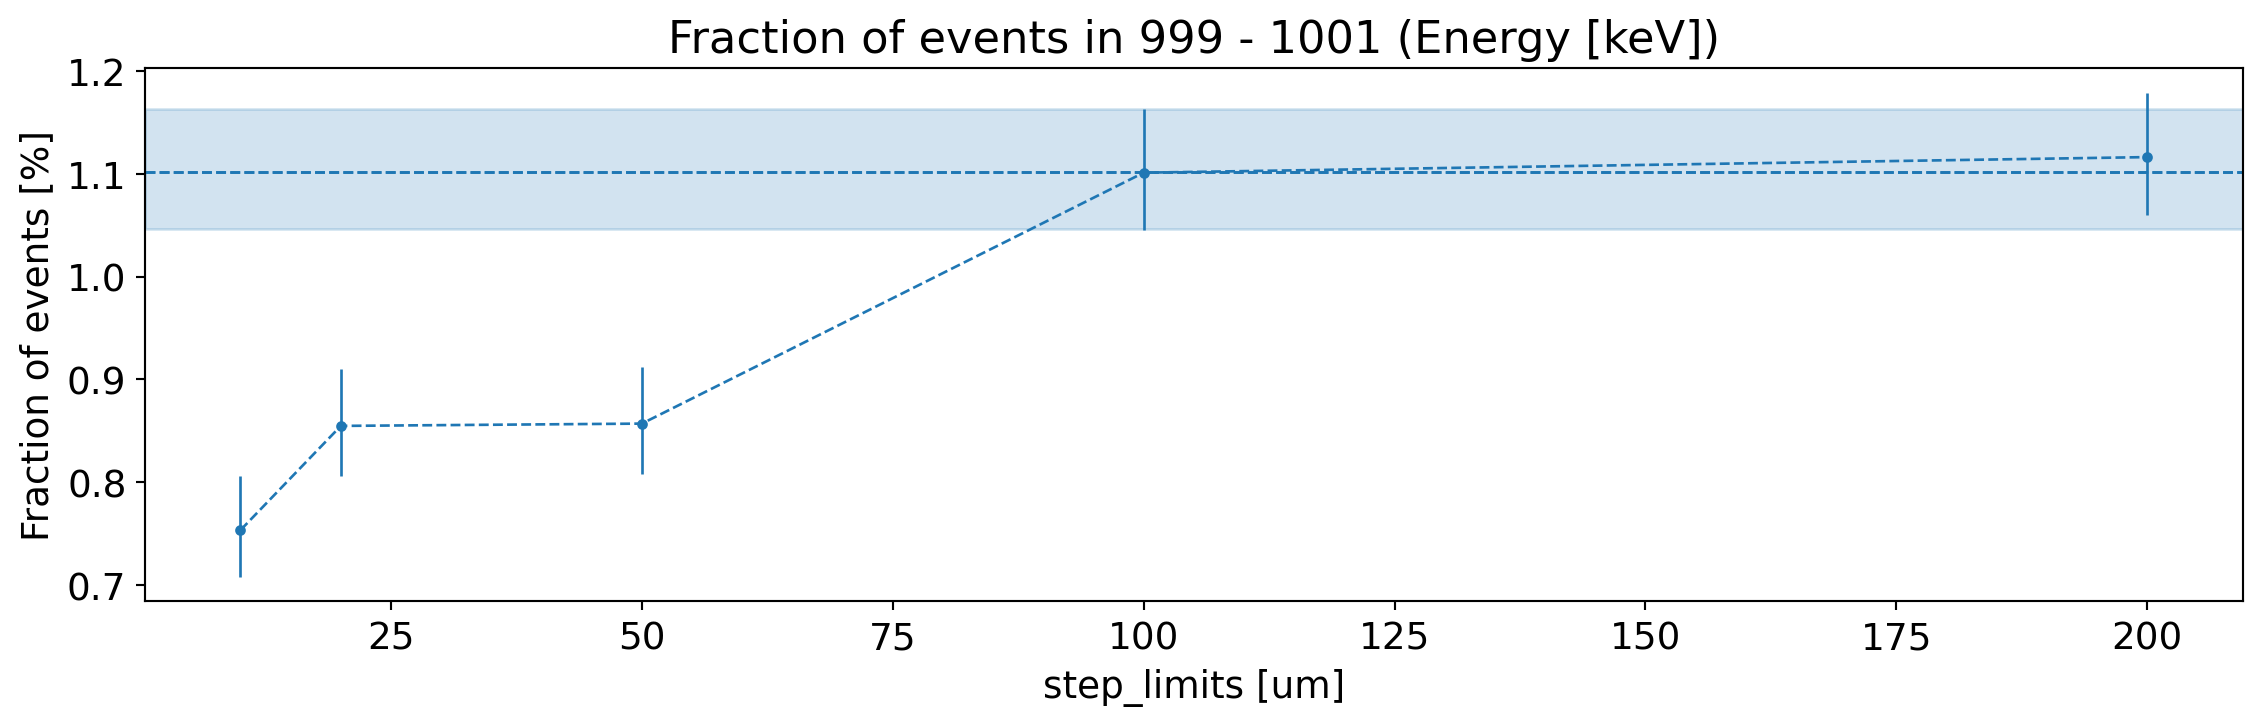
Fraction of generated electrons with fully reconstructed energy (within 1 keV), as a function of the step limits.
We do not expect differences based on the step limits, since the safety mechanism in Geant4 should ensure the correct amount of energy is deposited in each sensitive detector (essentially very small steps will be taken near the surface).
Active volume corrected energy
Next, we compute the energy after active volume correction (see [Bjoern Lehnert’s thesis] chapter 7). We employ a linear transition layer model with a 1 mm full-charge collection depth and a 0.5 mm linear component. The next plots show the spectrum and fraction of full energy peak events after this active volume correction.
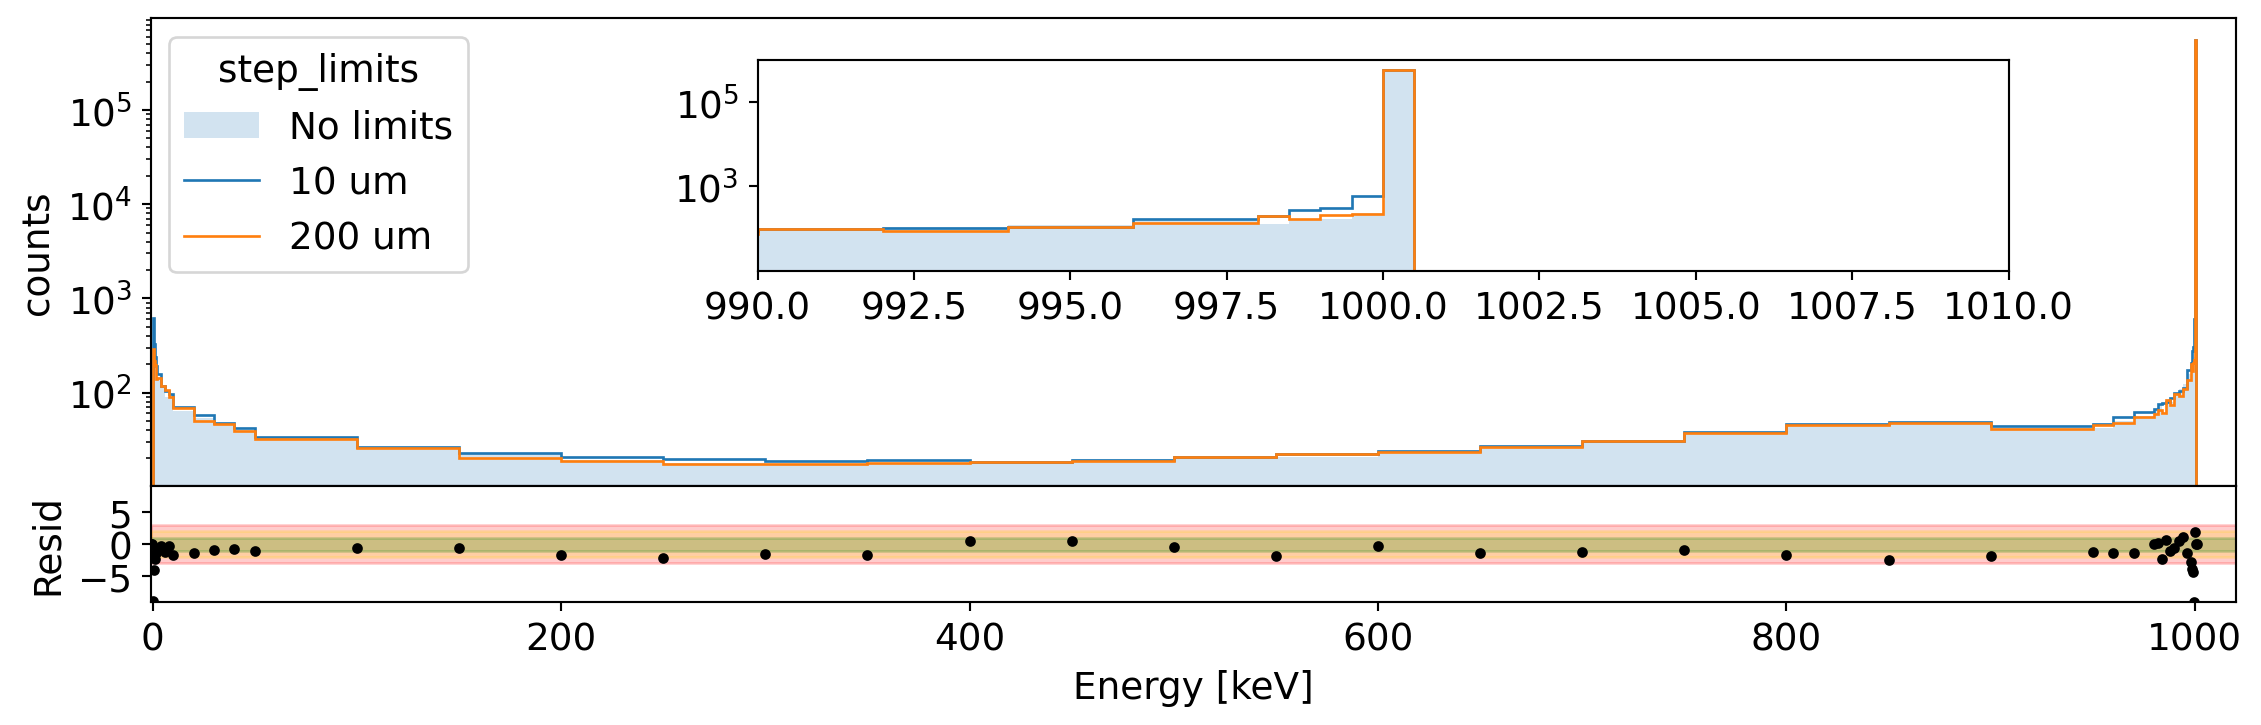
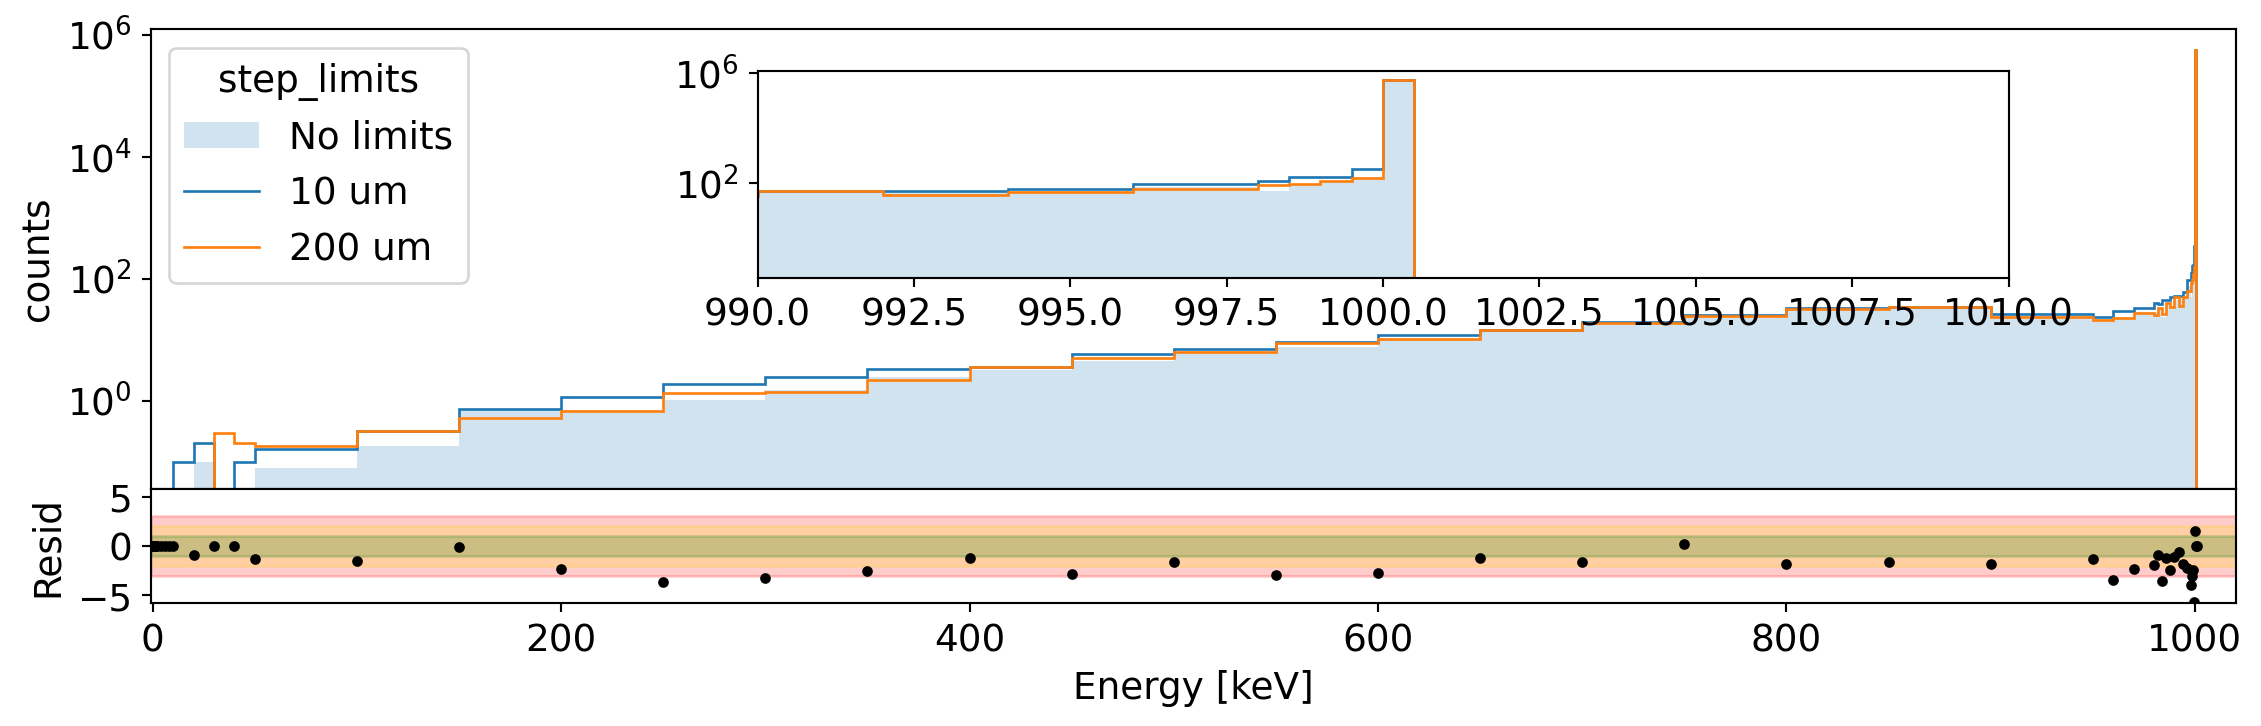
Spectrum of active energy in Germanium for 1 MeV electrons generated uniformly in the volume. We compare the spectrum without step limits to that with 10 um and 200 um limit. The residual shows the difference between the two extreme cases.
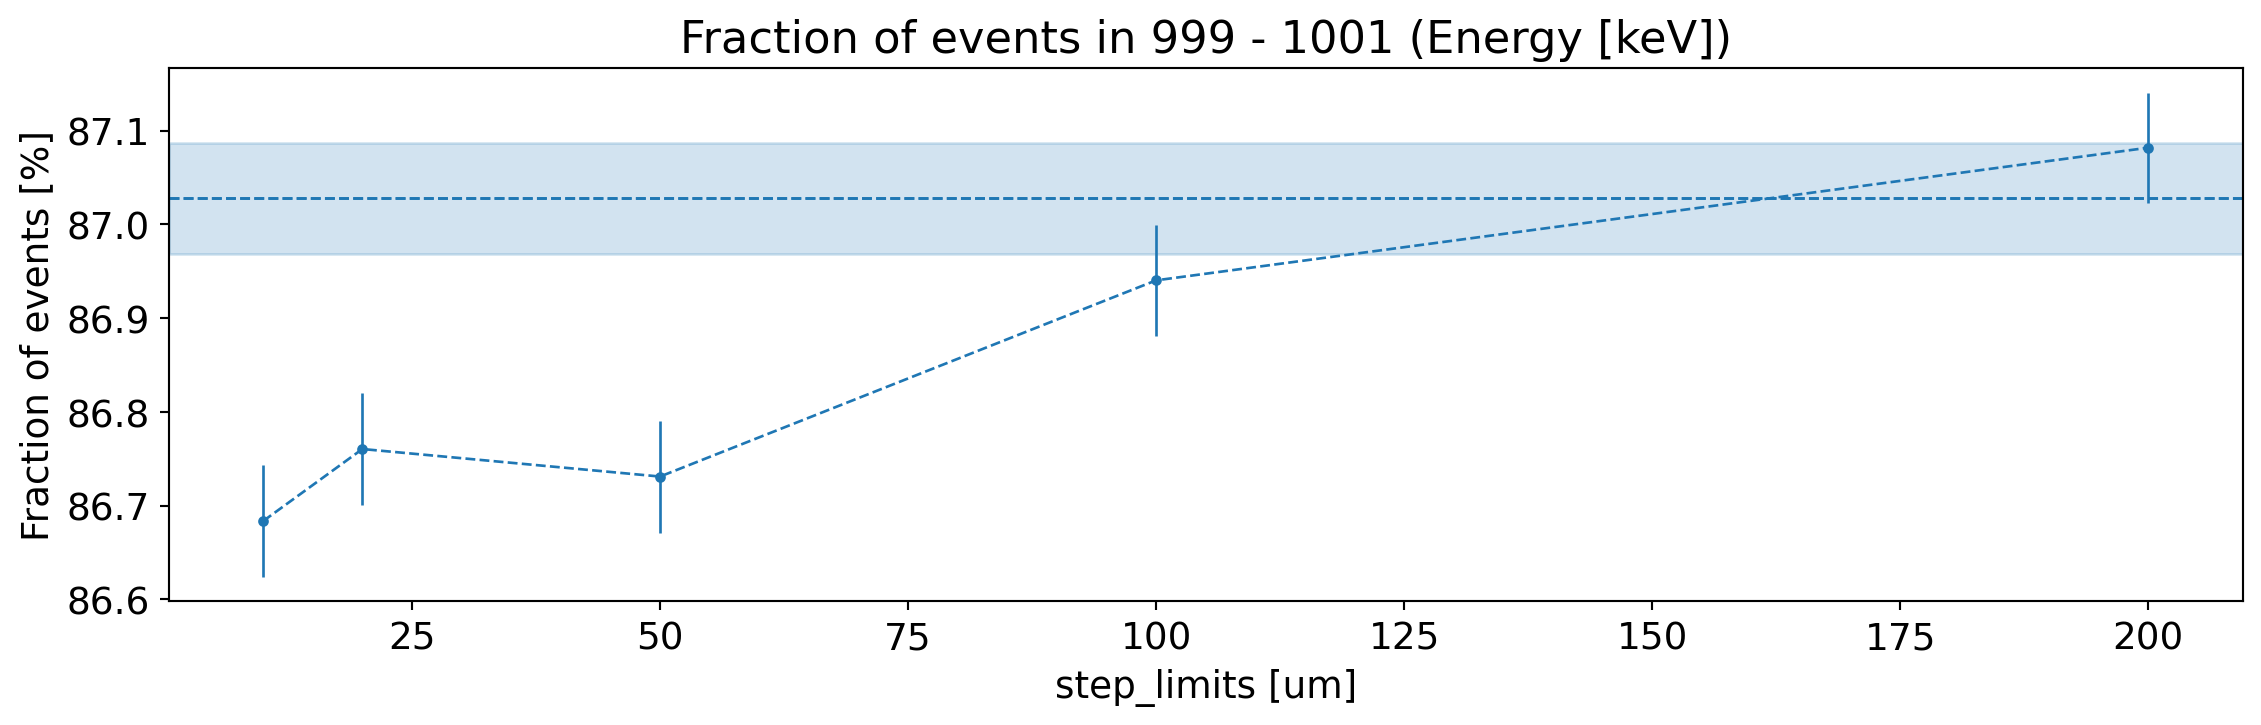
Fraction of generated electrons with fully reconstructed active energy (within 1 keV), as a function of the step limits.
It is possible we may see differences due to the introduction of the inactive region of the HPGe detector meaning the Geant4 default stepping is not necessarily high enough in this region.
However, the overall trends are driven by the fraction of events with vertices sampled in the partially active region. To decouple this effect from the variations due to step limitations we select the energies corresponding to vertices in the partially active region (distance to surface less than 1 mm) and in the bulk (distance greater than one mm).
Energy spectra for 1 MeV electrons in Germanium, selecting vertices in the transition region and the detector bulk.
Similar to the previous tests we also plot the fraction of events with energy within 1 keV of the full energy peak.
Fraction of generated electrons with fully reconstructed active energy (within 1 keV), as a function of the step limits.
You should observe that very few of the events from the transition layer deposit their full energy in the Germanium. You may also be able to observe some dependence on the efficiency for the vertices sampled inside the bulk of the detector
Pulse-shape heuristics
It is currently not possible to simulate the pulse-shape of a Germanium detector with Geant4. Work is ongoing to simulate the detector response with dedicated packages. Alternatively “pulse-shape-heuristics” are parameters that can be used to estimate if an event would have passed or failed a PSD cut. Whilst these are not technically observable it is still important to simulate them accuractely.
We focus on “r90” defined as the smallest radius (centered on the energy weighted center) or the event containing at-least 90% of the deposited energy. The spectrum of r90 for 1 MeV electrons in bulk is shown below:
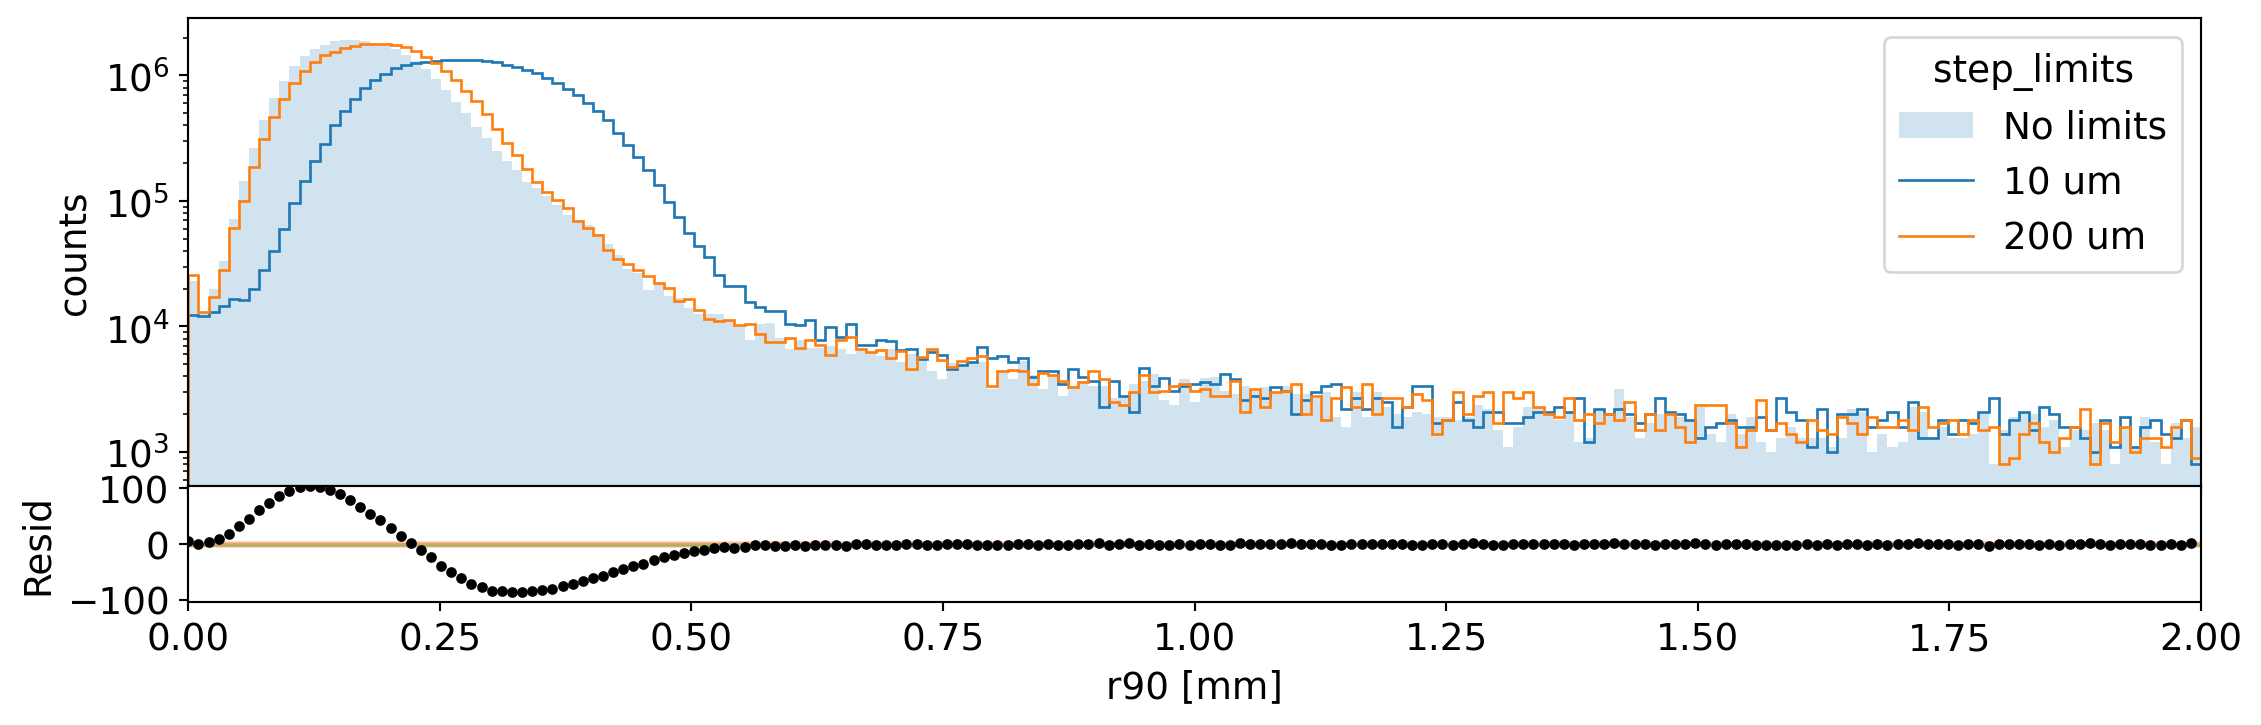
Spectrum of r90 in Germanium for 1 MeV electrons generated on the surface. We compare the spectrum without step limits to that with 10 um and 200 um limit. The residual shows the difference between the two extreme cases.
To quantify the effect of the step limits on our observable of interest (the fraction of multisite events), we compute the fraction of events with > 1 mm r90.
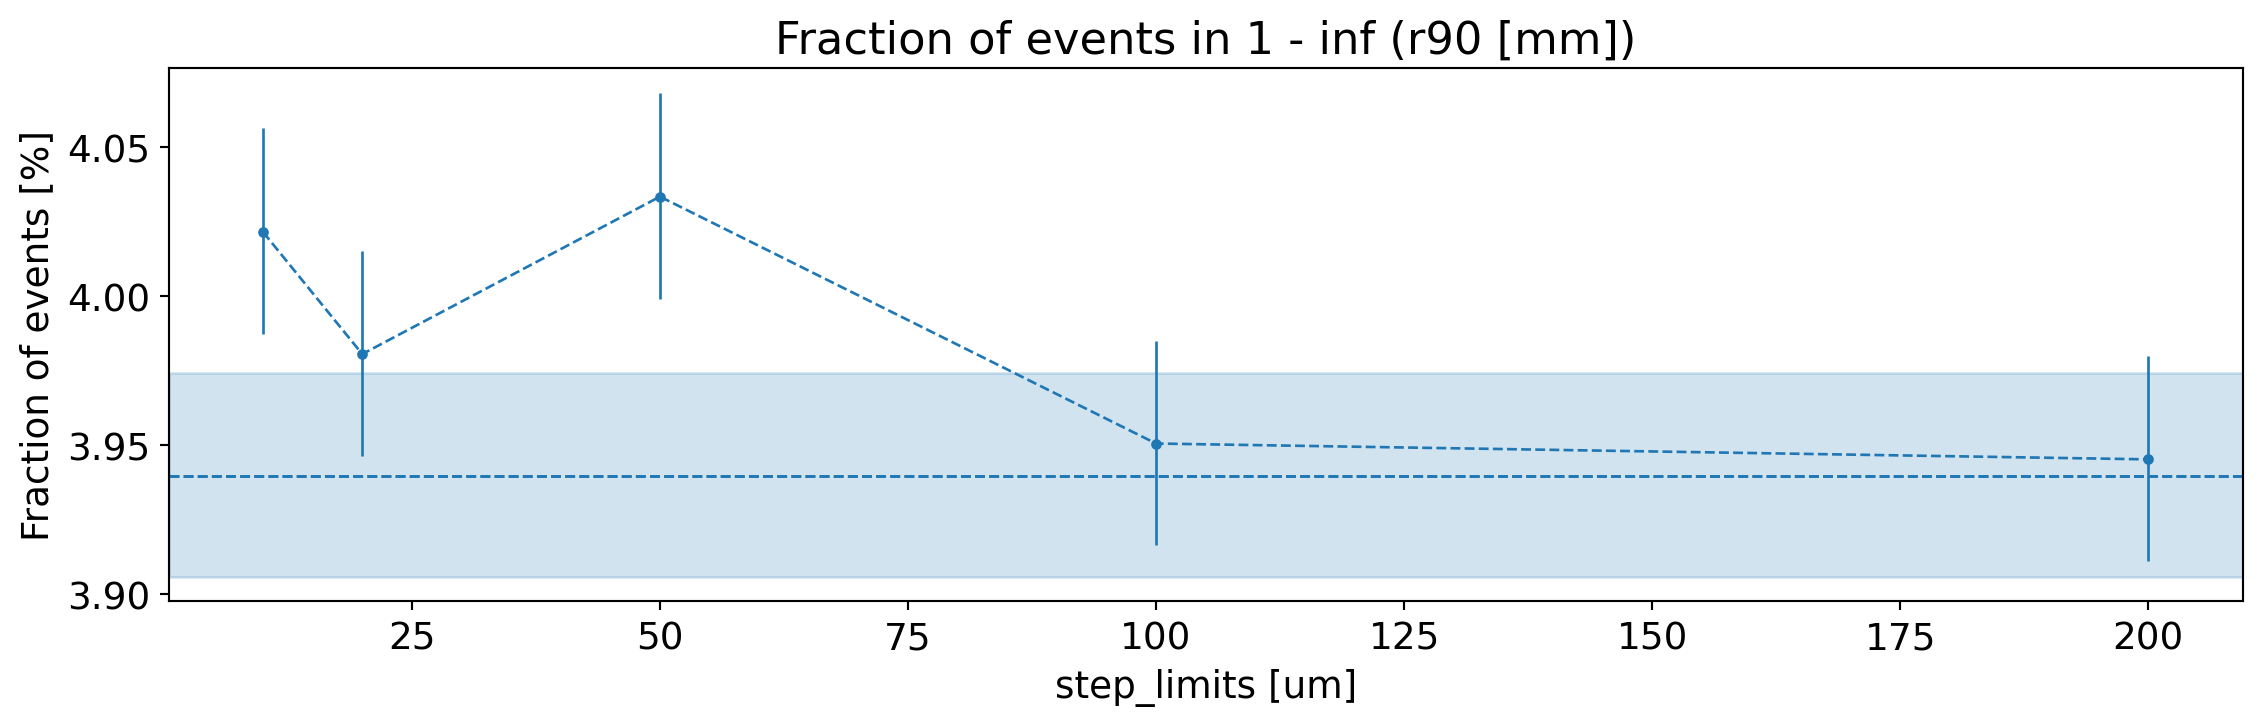
Fraction of generated electrons with r90 greater than 1 mm, as a function of the step limits.
Surface electrons
Total energy
Next we generate events on the surface of the HPGe detector. This is relevant for beta decays on the surface of the detector (eg. from Potassium-42) but also gives us a way to study more generally the surface effects.
We generated 1 MeV electrons on the center of the bottom surface of the detector, all pointing upwards. As before we extract the total deposited energy:
Spectrum of total energy in Germanium for 1 MeV electrons generated on the surface. We compare the spectrum without step limits to that with 10 um and 200 um limit. The residual shows the difference between the two extreme cases.
Fraction of generated electrons with fully reconstructed total energy (within 1 keV), as a function of the step limits.
Active volume corrected energy
Next we plot the spectrum after the active volume correction:
Spectrum of active energy in Germanium for 1 MeV electrons generated on the surface. We compare the spectrum without step limits to that with 10 um and 200 um limit. The residual shows the difference between the two extreme cases.
It is not expected to observe many events with 1 MeV deposited in the active volume. So as an observable we count the fraction of events with more than 300 keV deposited. This is relevant for the background induced by surface events.
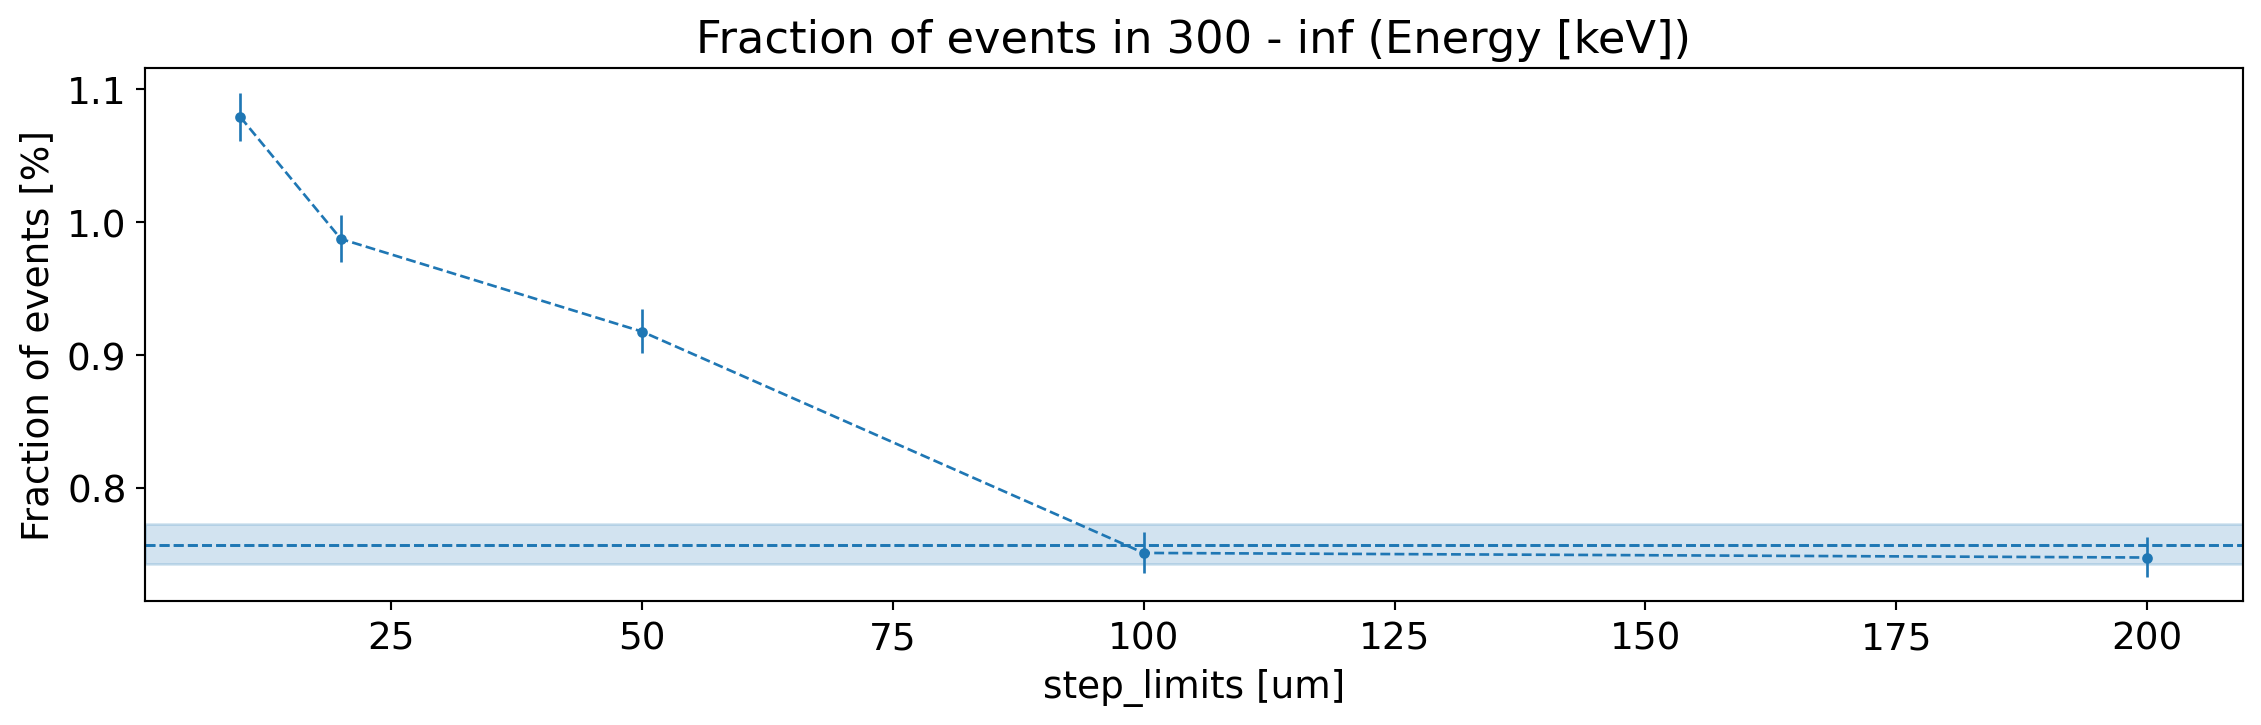
Fraction of generated electrons with more than 300 keV active energy, as a function of the step limits.
Again it is possible you may see differences relating to the step limits. However, it should be kept in mind that for simulations of beta’s, which is a continuous spectrum this detector response function will be conolved with the spectrum shape minimising the effect.
Range
Finally, we can extract the maximum z position of the electron, this gives a measurement of the range of the electrons. The spectrum of this parameter (not really an observable) is shown below:
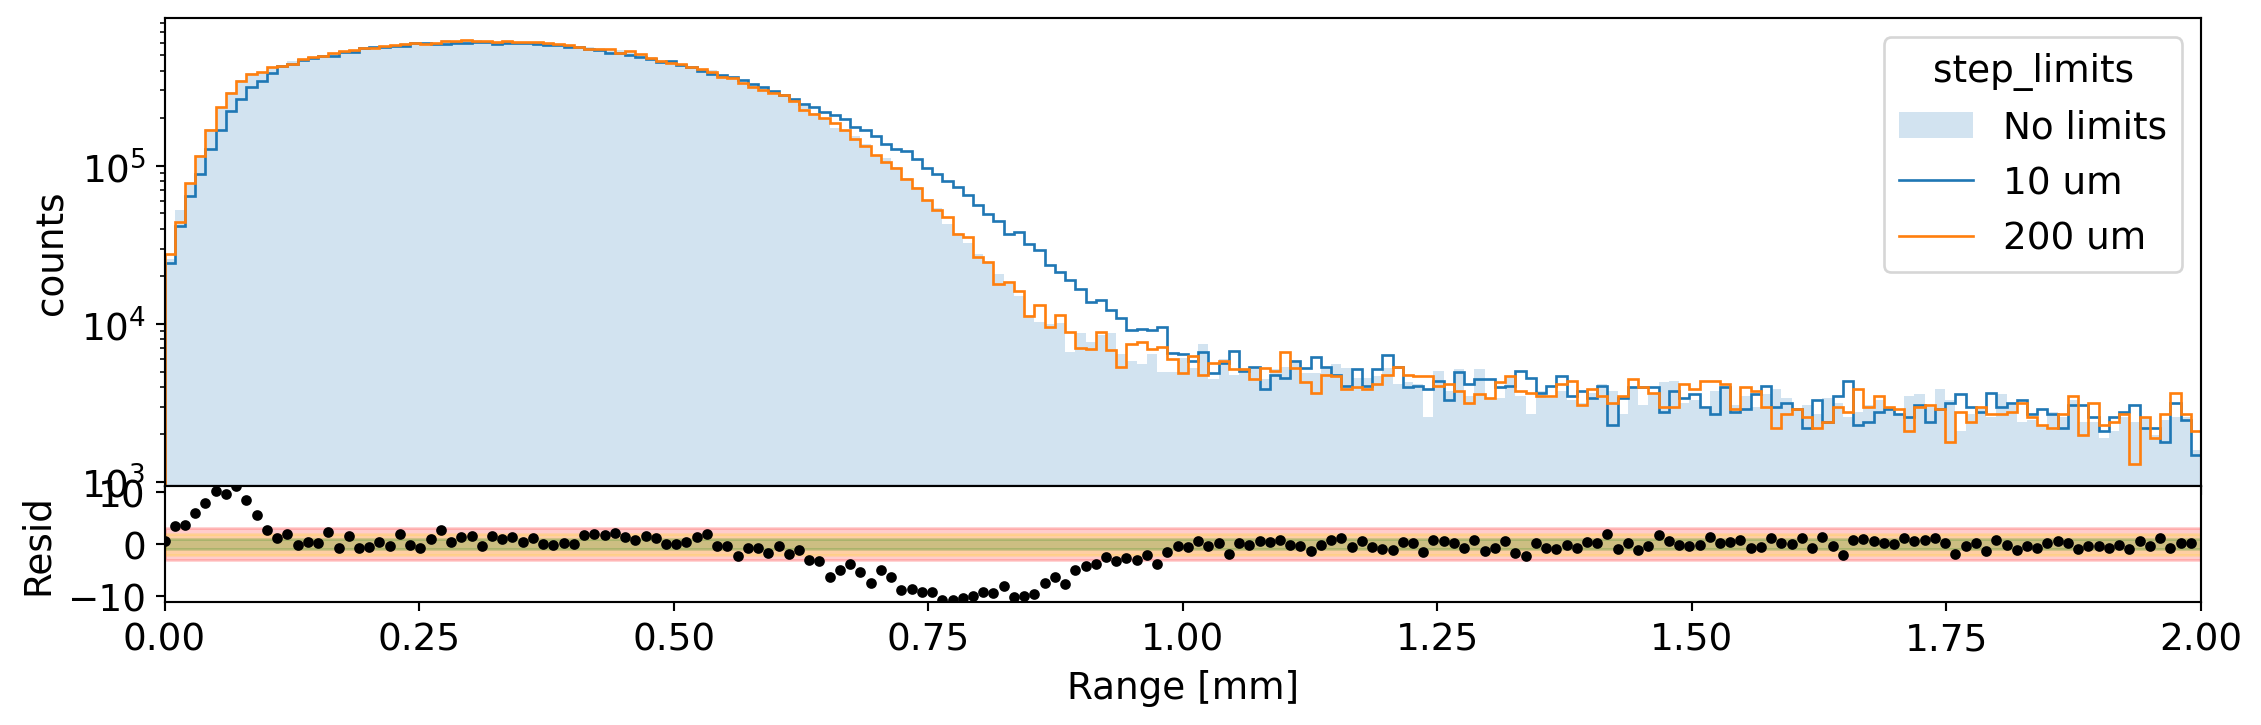
Distribution of the range of the electrons in Germanium for 1 MeV electrons generated on the surface. We compare the spectrum without step limits to that with 10 um and 200 um limit. The residual shows the difference between the two extreme cases.
To quantify this we extract the fraction of events with a range > 1 mm.
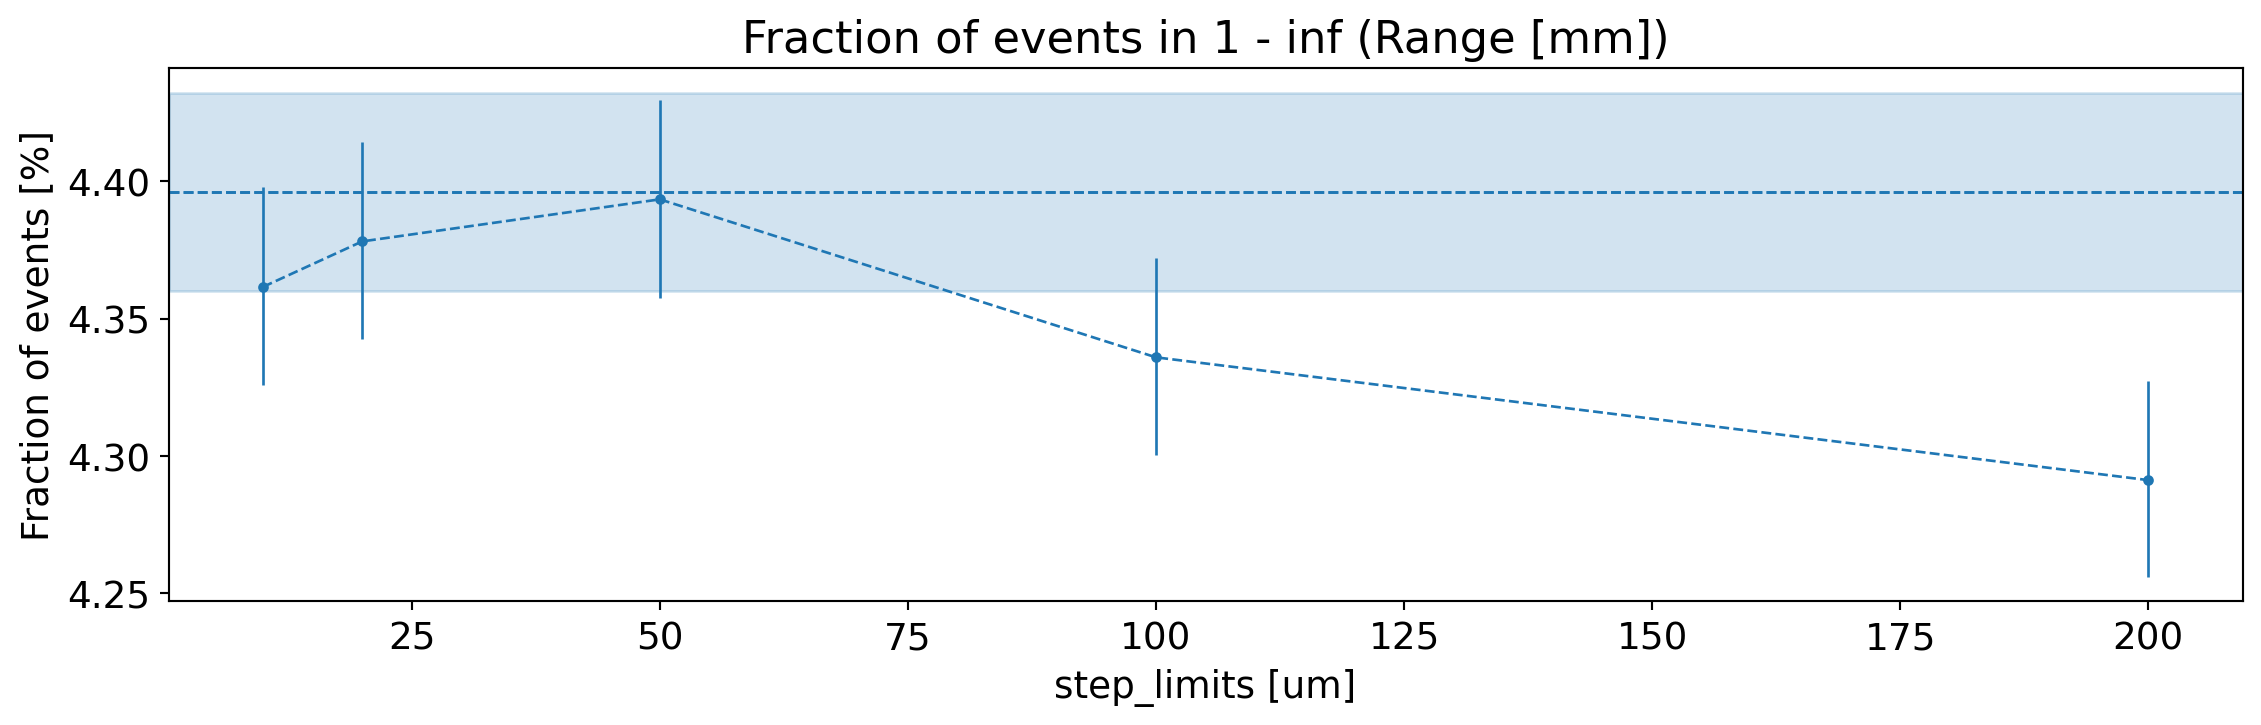
Fraction of 1 MeV electrons travelling more than 1 mm as a function of the step limits.